
SLIDE 1
COMPANY RESULTS HALF-YEAR 2020
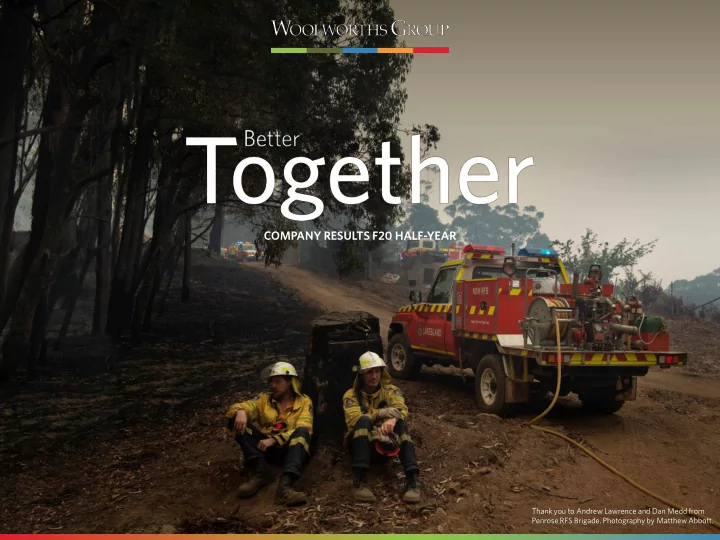
1 COMPANY RESULTS F20 HALF-YEAR
Thank you to Andrew Lawrence and Dan Medd from Penrose RFS Brigade. Photography by Matthew Abbott.
1 HALF-YEAR 2020 COMPANY RESULTS F20 HALF-YEAR Thank you to Andrew - - PowerPoint PPT Presentation
COMPANY RESULTS 1 HALF-YEAR 2020 COMPANY RESULTS F20 HALF-YEAR Thank you to Andrew Lawrence and Dan Medd from Penrose RFS Brigade. Photography by Matthew Abbott. COMPANY RESULTS Woolworths Group purpose 2 HALF-YEAR 2020 COMPANY RESULTS 3
COMPANY RESULTS HALF-YEAR 2020
1 COMPANY RESULTS F20 HALF-YEAR
Thank you to Andrew Lawrence and Dan Medd from Penrose RFS Brigade. Photography by Matthew Abbott.
COMPANY RESULTS HALF-YEAR 2020
2
Woolworths Group purpose
COMPANY RESULTS HALF-YEAR 2020
3
H20 GROUP SUMMARY & PROGRESS Brad Banducci 4 GROUP FINANCIAL RESULTS Stephen Harrison 12 BUSINESS PERFORMANCE UPDATE 24 OUTLOOK Brad Banducci 50
COMPANY RESULTS HALF-YEAR 2020
4
Standing together to support Australians through natural disasters
One of our values at Woolworths Group is that we care deeply and was at the core of our response to support Australians through the recent devastating bushfires
wildlife in bushfire affected areas
businesses was offered
further support team members and their families
COMPANY RESULTS HALF-YEAR 2020
5
Update on salaried store team member remediation
against GRIA
in H1)
extrapolation for prior years and other Group businesses
member payment shortfall estimated at $315 million ($265 million net of provisions recognised in F19)
completion of Fair Work investigation
relates
Published across media outlets 31 October 2019
COMPANY RESULTS HALF-YEAR 2020
6
H20 summary
Strong H1 sales and EBIT growth Online growth remains strong; X businesses continue to scale Pleasing improvement in BIG W profitability driven by Apparel Endeavour Drinks and Hotels restructure and merger completed; separation progressing Making progress on salaried team member remediation; initial payments made in December
COMPANY RESULTS HALF-YEAR 2020
7
Woolworths Group F20 priorities
Better for Customers, Simpler and Safer for Stores and Support Connected and Convenient Ways to Shop Customer 1st Brand, Team & Culture Build connected capabilities for the future Create differentiation in all our businesses Lean operating model leveraging core platforms Differentiate our Food Customer Propositions Evolve our Drinks Business Unlock Value in our Portfolio
COMPANY RESULTS HALF-YEAR 2020
8
Progress against key priorities
Cu Custo tomer 1 1st
st
Brand nd, Team & Cul ultur ure Conne
d and nd Con
nient W Ways to
hop Diff fferent ntiate our
Food
Cus ustom
Propos
impacted by bushfires; paid leave extended for volunteers
2019 Refinitiv D&I Index
members in H1
finalise salary review and embed improved processes
X businesses
customers
and first Countdown Metro opened
partnership revamped
strategy
including first sustainable supermarket
improvement in NZ Food
Our Brands and fresh inspiration and renew focus on customer and team
COMPANY RESULTS HALF-YEAR 2020
9
Progress against key priorities
Evol
Dr Drinks s Busi sines ess Unl Unloc
Value ue i in n our
Por
Bet etter er for Cust stomer ers, s, Simpler & S & Safer r for r Stores & S & Support
penetration in Wine
now available in over 700 stores
BWS MD, Scott Davidson and Dan Murphy’s MD, Alex Freudmann
performance especially in Apparel
Cartology and Woolworths International
building Group’s digital retail ecosystem
progress on mental health initiatives
supplying all Victorian stores
Operating Model implemented
Customer Operating Model; improve rostering practices; build on mental health initiatives
COMPANY RESULTS HALF-YEAR 2020
10
Woolworths Group digital retail ecosystem
Retail Services & Sustainability Digital, Data & Media Loyalty & Fintech eCom & Last mile Supply Chain
(Food stores)
Technology-enabled platform businesses
Our customers
woolworths.com.au
Deli live very ry
Unlimited
Pic Pick u up
In-store Drive-thru
Powered by team, technology and data
(Supermarkets)
Deli live very ry
Next day Same day
Deli live very ry
Now
COMPANY RESULTS HALF-YEAR 2020
11 H20 GROUP SUMMARY & PROGRESS Brad Banducci 4 GROUP FINANCIAL RESULTS Stephen Harrison Group financial results Key balance sheet metrics Cash flow summary Capital expenditure Capital management 12 BUSINESS PERFORMANCE UPDATE 24 OUTLOOK Brad Banducci 50
COMPANY RESULTS HALF-YEAR 2020
12
COMPANY RESULTS HALF-YEAR 2020
13
H20 results summary
1 Certain comparatives have been re-presented to conform with the current period’s presentation to better reflect the nature of the financial position and performance of the Group. The impact of the coststo remediate salaried store team members has been corrected by the restatement of each of the affected financial statements line items for prior periods in accordance with the requirements for the correction of an error under AASB 108
2 Normalised results and growth reflect adjustments to H19 if AASB 16 had been in place in F19$ MILLION REPORTED H20 PRE-AASB 16 REPORTED1 H19 CHANGE
Continuing operations before significant items Sales 32,410 30,587 6.0% EBIT 1,893 1,419 33.5% NPAT 979 902 8.5% Basic EPS – cents 77.9 68.9 13.1% Group after significant items EBIT 1,762 1,503 17.3% NPAT 887 961 (7.7)% Dividend per share – cents 46 45 2.2%
$ MILLION REPORTED H20 POST-AASB 16 NORMALISED2 H19 NORMALISED2 CHANGE
Continuing operations before significant items (post-AASB 16) EBIT 1,893 1,700 11.4% NPAT 979 846 15.7% Reported Normalised for AASB 16
COMPANY RESULTS HALF-YEAR 2020
14
Normalised Group EBIT up 11.4% on F19
$ MILLION REPORTED H20 POST-AASB 16 NORMALISED1 2 3 H19 POST-AASB 16 NORMALISED1 CHANGE
Continuing operations before significant items Australian Food 1,177 1,090 8.0% New Zealand Food 175 161 8.8% New Zealand Food (NZD) 186 175 6.4% Endeavour Drinks 338 316 6.7% BIG W 50 20 155.3% Hotels 224 207 8.3% Central Overheads (71) (94)3 (24.8)% EBIT from continuing operations before significant items 1,893 1,7003 11.4%
Group EBIT/(LBIT) Post-AASB 16
Strong EBIT improvement across all businesses in the half
1 Normalised results and growth reflect adjustments to H19 if AASB 16 had been in place in F19 2 Certain comparatives have been re-presented to conform with the current period’s presentation to better reflect the nature of the financial position and performance of the Group 3 The impact of the costs to remediate salaried store team members has been corrected by the restatement of each of the affected financial statements line items for prior periods in accordance with therequirements for the correction of an error under AASB 108
COMPANY RESULTS HALF-YEAR 2020
15
Group EBIT excluding AASB 16 impact in F20
$ MILLION PRE-AASB 16 NORMALISED1 H20 REPORTED2 3 H19 PRE-AASB 16 NORMALISED1 CHANGE
Continuing operations before significant items Australian Food 1,018 933 9.0% New Zealand Food 150 137 9.7% New Zealand Food (NZD) 158 148 6.9% Endeavour Drinks 309 294 5.2% BIG W 21 (8) n.m. Hotels 178 161 10.8% Central Overheads (72) (98)2 3 (27.0)% EBIT from continuing operations before significant items 1,604 1,4192 3 13.1%
Group EBIT/(LBIT) Pre-AASB 16
Excluding AASB 16 in H20, normalised Group EBIT increased by 13.1%
1 Normalised results and growth reflect adjustments to H20 if AASB 16 had not been in place in F20 2 Certain comparatives have been re-presented to conform with the current period’s presentation to better reflect the nature of the financial position and performance of the Group 3 The impact of the costs to remediate salaried store team members has been corrected by the restatement of each of the affected financial statements line items for prior periods in accordance with therequirements for the correction of an error under AASB 108
COMPANY RESULTS HALF-YEAR 2020
16
Impact of restatement on financial statements for salaried store team member remediation
$ MILLION FINANCIAL STATEMENT IMPACT
F18 and pre-F18 payment shortfall 263 Opening retained earnings - F19 balance sheet H19 payment shortfall 26 H19 profit or loss and balance sheet H2 F19 payment shortfall 26 F19 profit or loss and balance sheet Gross payment shortfall for prior periods 315 Provisions recognised in H2 F19 (50) Net payment shortfall for prior periods 265 Interest and other costs 80 H20 profit or loss (significant items) and balance sheet Net remediation cost 345 Repaid to team members in H20 (69) H20 cash flow statement
Ongoing annualised impact across Group of $35 - $45 million before any mitigation
Net before-tax impact on F19 of $(2)m
COMPANY RESULTS HALF-YEAR 2020
17
H201
$ MILLION
Pre-AASB 16 NORMALISED2 REPORTED Impact of AASB 16
EBITDA 2,263 3,141 878 D&A (659) (1,248) (589) EBIT 1,604 1,893 289 Interest expense (71) (440) (369) Tax (452) (429) 23 Non-controlling interests (45) (45)
1,036 979 (57)
H19
$ MILLION
REPORTED3 Post- AASB 16 NORMALISED4 Impact of AASB 16
EBITDA 2,030 2,850 820 D&A (611) (1,150) (539) EBIT 1,419 1,700 281 Interest expense (71) (431) (360) Tax (404) (381) 23 Non-controlling interests (42) (42)
902 846 (56)
Key P&L lines impacted by the introduction of AASB 16. Similar NPAT impact in both years
1Before significant items 2 Normalised results and growth reflect adjustments to H20 if AASB 16 had not been in place in F20 3 Certain comparatives have been re-presented to conform with the current period’s presentation to better reflect the nature of the financial position and performance of the Group. The impact of the coststo remediate salaried store team members has been corrected by the restatement of each of the affected financial statements line items for prior periods in accordance with the requirements for the correction of an error under AASB 108
4 Normalised results and growth reflect adjustments to H19 if AASB 16 had been in place in F19 COMPANY RESULTS HALF-YEAR 2020
18
Key balance sheet lines impacted by introduction of AASB 16
23.6 13.1 10.5 1.6 36.4 27.3 9.1 16.3 36.7 27.3 9.4 15.9
Group assets Group liabilties Total equity Total net debt (including lease liabilities) $ billion
F19 1 July F20 H20
Recognition of lease assets +$12.2bn, net deferred tax assets +$0.6bn Recognition of lease liabilities +$14.7bn and
Reduction in retained earnings of $1.4bn Increase in total net debt due to lease liabilities of $14.7bn
COMPANY RESULTS HALF-YEAR 2020
19
Balance sheet metrics improved on prior year
Average inventory days declined by 1.6 days due to successful inventory management programs
Average inventory days
Days
Normalised ROFE
Percentage
Continuing operations – post-AASB 16 Continuing operations – pre-AASB 16
All numbers exclude significant items in F16, F19 and F20
40.6 41.3 40.3 40.5 38.9 41.6 39.3 37.1 37.3 38.3 H16 H17 H18 H19 H20
Continuing operations Group
Group ROFE - continuing operations increased 134 bps largely due to strong Group EBIT growth
13.3 14.6
24.2
H19 H20
H19 ROFE impacted by inclusion
COMPANY RESULTS HALF-YEAR 2020
20
$ MILLION REPORTED H20 PRE-AASB 16 REPORTED1 H19 CHANGE
EBITDA – continuing operations 3,141 2,030 54.8%
+ve AASB 16 impact with fixed rent becoming lease interest and repayment of lease liabilities. Normalised EBITDA growth of 10.3% from continuing operations before significant items
EBITDA – discontinued operations
n.m. Significant items (131)
EBITDA growth impacted by discontinued
Group EBITDA 3,010 2,114 42.4% Working capital and non-cash movements (59) 373 (115.8)%
Impacted by trade payables timing in H20
Operating activities before interest & tax 2,951 2,487 18.7% Interest paid – leases (414)
lease interest
Interest paid – non-leases (91) (86) 5.8% Tax paid (385) (386) (0.3)% Operating activities 2,061 2,015 2.3% Investing activities (761) (911) (16.5)%
Capex discussed on slide 21
Free cash flow before lease payments, dividends and share issues 1,300 1,104 17.8% Dividends and share payments (649) (703) (7.7%)
H19 incl. cash payment of F18 10c special dividend
Repayment of lease liabilities (602)
repayment of lease liabilities
Free cash flow after lease payments, dividends and share issues 49 401 (87.8)%
Normalised EBITDA growth with lower capex and lower cash dividends offset by trade payables timing
Cash realisation ratio (CRR) 95% 123% 29 pts
Free cash flow lower than prior year due to working capital timing
1 Certain comparatives have been re-presented to conform with the current period’s presentation to better reflect the nature of the financial position and performance of the Group. The impact of the costs to remediate salaried storeteam members has been corrected by the restatement of each of the affected financial statements line items for prior periods in accordance with the requirements for the correction of an error under AASB 108
COMPANY RESULTS HALF-YEAR 2020
21 10% 23% 16% 35% 6% 10%
Operating capex below prior year due to Supply Chain and timing of Renewal spend
$ MILLION
H20 H191
Continuing operations Operating capex2 683 800 Property development 222 227 Gross capex 905 1,027 Property sales (174) (101) Net capex 731 926 Discontinued operation ̶ 18 Group net capex 731 944 Lease asset additions (net) 250 n.a. Operating capex – H20 Operating capex – H19
1 Property acquisitions now included in property development, previously in operating capex.The comparative has been represented on the same basis
2 Acquisitions of businesses are included in operating capex (H20: $38m, H19: $23m)$683m
New stores / acquisitions Renewals / refurbs Supply Chain IT SIB / other Growth/ productivity
6% 35% 17% 24% 10% 9% $800m
F20 operating capex expected to be ~$1.7 billion
COMPANY RESULTS HALF-YEAR 2020
22
Capital management and funding
10
43 45 46 50 57
10
57.9% 61.7%1 59.3%
7
F18 F19 H20
Dividends (cents per share) Final Interim Special Interim payout ratio2
Fully-franked interim dividend up 2.2% to 46 cps
Excluding non-comparable Petrol earnings in H19, interim dividend is up 9.5%
framework will be considered following a successful separation of Endeavour Group Committed to solid investment grade credit ratings Credit metrics have significant headroom above thresholds for current ratings S&P: BBB (stable outlook)5 Moody’s: Baa2 (stable outlook)5 No change to ratings expected after AASB 16
Sources of funding and liquidity remain strong
1,000 1,500 2,000 2,500
2020 2021 2022 2023 2024 2025 Beyond Debt maturity profile ($m) Capital markets debt Bank debt3
refinanced in Nov 2019 with 4, 5 and 7 year tranches lowering effective interest rate and increasing weighted average maturity
(F19: $1,599m) broadly in line with F19
1 Restated for the impact of the costs to remediate salaried store team members in accordance with therequirements for the correction of an error under AASB 108
2 Based on Group NPAT attributable to equity holders of the parent entity before significant items 3 Total committed facilities (drawn and undrawn) 4 Excluding lease liabilities 5These credit ratings have been issued by a credit rating agency which holds an Australian Financial ServicesLicence with an authorisation to issue credit ratings to wholesale clients only and are published for the benefit of Woolworths Group’s debt providers
COMPANY RESULTS HALF-YEAR 2020
23
H20 GROUP SUMMARY & PROGRESS Brad Banducci
4
GROUP FINANCIAL RESULTS Stephen Harrison
12
BUSINESS PERFORMANCE UPDATE
24
OUTLOOK Brad Banducci
50
COMPANY RESULTS HALF-YEAR 2020
24
25
COMPANY RESULTS HALF-YEAR 2020
Australian Food
REPORTED H20 POST-AASB 16 NORMALISED1 H19 POST-AASB 16 NORMALISED1 CHANGE
Sales ($m) 21,200 19,928 6.4% EBITDA ($m) 1,929 1,757 9.8% EBIT ($m) 1,177 1,090 8.0% Gross margin (%) 29.1 28.8 38 bps Cost of doing business (%) 23.6 23.3 29 bps EBIT to sales (%) 5.6 5.5 8 bps Sales per square metre ($) 17,236 16,656 3.5% ROFE (%) 25.2 25.3 (15) bps
PRE-AASB 16 NORMALISED2 H20 REPORTED3 H19 PRE-AASB 16 NORMALISED2 CHANGE
EBIT – pre-AASB 16 comparable basis 1,018 933 9.0% EBIT – pre-AASB 16 comparable basis to sales (%) 4.8 4.7 12 bps H20 Normalisation – pre-AASB 16
1 Normalised results and growth reflect adjustments to H19 if AASB 16 had been in place in F19 2 Normalised results and growth reflect adjustments to H20 if AASB 16 had not been in place in F20 3 Comparatives have been re-presented to reflect the transfer of the Summergate business from Endeavour Drinks to Australian Food 26
COMPANY RESULTS HALF-YEAR 2020
Australian Food delivering strong sales in H1
Total sales (% year on year) Comp transactions (% year on year) Comp items per basket (% year on year) Comp sales growth (% year on year)
2.7 4.7 4.0 7.8 4.9 Q2 F19 Q3 F19* Q4 F19* Q1 F20 Q2 F20
2.6% 4.2%* 3.5%* 6.6% 3.8%
1.5 1.9 1.4 2.8 0.7 Q2 F19 Q3 F19* Q4 F19* Q1 F20 Q2 F20 2.6 2.6 1.2 1.9 0.9 Q2 F19 Q3 F19* Q4 F19* Q1 F20 Q2 F20
* Adjusted for the timing of Easter with Q4 also normalised for the impact of the 53rd week in F19
27
COMPANY RESULTS HALF-YEAR 2020
55 47 52 49 51
Q2'19 Q3'19 Q4'19 Q1'20 Q2'20
83 78 80 80 80
Q2'19 Q3'19 Q4'19 Q1'20 Q2'20
Brand NPS remains strong; plans in place to improve customer scores in H2
Store-controllable VOC1
% customers satisfied, 6 & 7 out of 7
NPS - Store & Online1,2
% promoters - % detractors
28
COMPANY RESULTS HALF-YEAR 2020
F20 strategy
E2E Processes that are Better for Customers, Simpler and Safer for Stores & Support Connected, Personalised and Convenient Ways to Shop my Woolies Customer 1st Brand, Team & Culture Build Customer & Team advocacy Differentiate our Core Customer Offer Deliver our new E2E
Trusted Prices and Localised Range Engaging and Easy Woolies Experience Famous for Fresh Every Time
29
COMPANY RESULTS HALF-YEAR 2020
Customer scores WooliesX Team and Safety Community & Bushfires
51 VOC NPS
+2 pts vs Q1 F20; -4 vs H19
80% Store-controllable VOC
stable H20, -3% vs H19 Plans to improve in H2 F20
38% H20 Online
Sales Growth; 4.4% sales penetration
12 million Woolworths
Rewards members
13,400* team members
completed I am Here training for mental wellbeing support H20 Total Recordable Injuries reduced by 9.6% vs H19
200 pallets of Food and
essentials donated to bushfire impacted communities
$1 million raised in
partnership with customers at Xmas to support OzHarvest
Progress highlights
Differentiate core customer offer Innovate our customer and team experience Redesign E2E Operating model
Store network New store formats Fresh offer Differentiated range
14 new stores (net) 36 Renewals
(32 Supermarkets, 4 Metros)
2 Smart Stores launched
Millers Junction (VIC) & Chullora (NSW)
New sustainable Supermarket Burwood Brickworks (VIC)
Fresh Made Easy deployed nationally Famous for Fruit & Vegetables implemented in 270 stores Emerging categories showing continued growth including Free From, Asian and vegan ranges
Better for customers Better for stores Total stock loss Efficient supply chain
Roll out of new customer
changes within stores Continued to build momentum across our Simpler for Stores program, delivering a number of initiatives during the half Reduced total stock loss through a number of initiatives including reactivation of scales
Ramp up of MSRDC continuing now supplying all Victorian stores
* Woolworths Supermarkets, Metro and FoodCo team members
30
COMPANY RESULTS HALF-YEAR 2020
Woolworths in the community
Supporting Communities
inspire the next generation of environmental champions via Woolworths Junior Landcare Grants
customers at Christmas to support OzHarvest
than 14,000 schools nationwide as part of the Woolworths Earn and Learn program
collections in August
through our Free Fruit for Kids Program
Tours in H1, bringing the total to more than 250,000 kids who have learnt about fresh fruit and vegies since launch
31
COMPANY RESULTS HALF-YEAR 2020
VOC NPS 61 maintained with high
lead up to Christmas
Strong eCom momentum Ultra-convenient experiences Rewards expansion
* “Outstanding Customer Satisfaction”, “Range of Products”, “Freshness”, “Online Shopping Experience”, “Delivery Service”, “Click and Collect” and “Most Recommended”
WooliesX showing continued strong momentum
eCom growth at 38% YoY in H1, supported by continued strong growth in Pick up offer Multiple customer awards No.1 Customer Satisfaction for Online Groceries by Canstar Blue and multiple awards by Mozo* ...members in our Rewards program (+0.7m vs Dec LY) with scan rates continuing to improve across all banners
12 million
Relaunched Qantas partnership in Oct ‘19, allowing Rewards members to convert 2,000 Reward points into 1,000 Qantas points and simplifying the customer experience Scan&Go pilot live in 10 stores, 4 Supermarkets and 6 Metros Continued to expand Delivery Now proposition across Sydney, Melbourne and Brisbane Rewards access launched within the Woolworths mobile app, so customers can view their points as well as activate and track their offers Continued investment into digital experiences and convenient options e.g. relaunch of Delivery Unlimited subscription, track my
across web and app Digital traffic growing to over
COMPANY RESULTS HALF-YEAR 2020
32
33
COMPANY RESULTS HALF-YEAR 2020
New Zealand Food
NZD REPORTED H20 POST-AASB 16 NORMALISED1 H19 POST-AASB 16 NORMALISED1 CHANGE
Sales ($m) 3,564 3,401 4.8% EBITDA ($m) 316 294 7.5% EBIT ($m) 186 175 6.4% Gross margin (%) 24.7 24.3 46 bps Cost of doing business (%) 19.5 19.1 38 bps EBIT to sales (%) 5.2 5.1 8 bps Sales per square metre ($) 16,704 16,009 4.3% ROFE (%) 8.1 7.8 26 bps
PRE-AASB 16 NORMALISED2 H20 REPORTED H19 PRE-AASB 16 NORMALISED2 CHANGE
EBIT – pre-AASB 16 comparable basis 158 148 6.9% EBIT – pre-AASB 16 comparable basis to sales (%) 4.4 4.4 9 bps H20 Normalisation – pre-AASB 16
1 Normalised results and growth reflect adjustments to H19 if AASB 16 had been in place in F19 2 Normalised results and growth reflect adjustments to H20 if AASB 16 had not been in place in F20 34
COMPANY RESULTS HALF-YEAR 2020
New Zealand Food F20 priorities
End to End Process Excellence and Capabilities for the Future Create Convenient, Connected and Innovative Shopping Experiences Customer 1st Brand, Team and Culture Differentiate through innovation and culture Grow customer loyalty through a stronger core proposition Simplify and future proof our E2E
Prices I Trust, Rewards I Value, Exclusive Range Good Food with a Focus on Fresh and Health Genuine Service in Every Local Community
35
COMPANY RESULTS HALF-YEAR 2020
H2’20 focus
New Zealand Food highlights
H1 highlights
Customer 1st Team 1st Convenient and Connected Sales Growth Great Prices and Good Acts Customer 1st Team 1st Culture Digital Experience and Online Growth End to End Process Excellence Health, Fresh and Sustainability
Continued brand advocacy strengthening to new highs H1 online sales growth vs last year Opened first Metro and announced first NZ eStore
H20 total sales growth
32.7%
Online sales penetration H1
8.2%
TEAM
Improved Safety, Voice of Team, Voice of Supplier and Everyday Acts metrics
NPS
COMPANY RESULTS HALF-YEAR 2020
36
37
COMPANY RESULTS HALF-YEAR 2020
BIG W
REPORTED H20 POST-AASB 16 NORMALISED1 H19 POST-AASB 16 NORMALISED1 CHANGE
Sales ($m) 2,149 2,091 2.8% EBITDA ($m) 138 112 23.6% EBIT ($m) 50 20 155.3% Gross margin (%) 32.6 31.2 137 bps Cost of doing business (%) 30.2 30.3 (2) bps EBIT to sales (%) 2.3 0.9 139 bps Sales per square metre ($) 3,609 3,442 4.9% ROFE (%) 0.0 (3.9) 3.9 pts
PRE-AASB 16 NORMALISED2 H20 REPORTED H19 PRE-AASB 16 NORMALISED2 CHANGE
EBIT/(LBIT) – pre-AASB 16 comparable basis 21 (8) n.m. EBIT/(LBIT) – pre-AASB 16 comparable basis to sales (%) 1.0 (0.4) 133 bps H20 Normalisation – pre-AASB 16
1 Normalised results and growth reflect adjustments to H19 if AASB 16 had been in place in F19 2 Normalised results and growth reflect adjustments to H20 if AASB 16 had not been in place in F20 38
COMPANY RESULTS HALF-YEAR 2020
BIG W F20 priorities
39
COMPANY RESULTS HALF-YEAR 2020
BIG W highlights
H20 highlights
Simplification of business processes and operations continued Continued to invest in price where it matters with more focus on full price selling Improved ranges in seasonal apparel supported by new fixtures and brands Improved digital offering and promotions Successful launch of new brand platform "Every Day’s a Big Day"
Focus for the next 6 months
Simplify business by continuing to curate ranges and streamline processes Remain competitive on price while optimising approach to promotions and clearance Refresh fixtures in additional categories across the store network Offer more ways for customers to shop BIG W with a focus on convenience Continue to demonstrate real care to the communities BIG W operates in
1 2 3 4 5
COMPANY RE Y RESU SULTS HALF-YEAR 2020
40
COMPANY RE Y RESU SULTS HALF-YEAR 2020
41
Separation of Endeavour Group Limited update
As a result of these transactions, Woolworths Group now owns 85.4% of Endeavour Group, while Bruce Mathieson Group owns the remaining 14.6% The planned separation of Endeavour Group is on track to occur later in CY2020. A dedicated internal team and advisor group continues to progress transaction execution and operational separation The creation of Endeavour Group was completed in early February through the internal restructure of Woolworths Group's retail drinks business, and the merger of this business with ALH Group Key leadership appointments for Endeavour Group have been made, with Peter Hearl appointed as Chairman-elect, Steve Donohue as CEO-elect and Colin Storrie as COO/CFO-elect. These positions will take effect in the event of a separation We will provide further information on the expected timing and process for the separation at the appropriate time
COMPANY RESULTS HALF-YEAR 2020
42
43
COMPANY RESULTS HALF-YEAR 2020
Endeavour Drinks
REPORTED H20 POST-AASB 16 NORMALISED1 H19 POST-AASB 16 NORMALISED1 CHANGE
Sales ($m) 4,775 4,560 4.7% EBITDA ($m) 465 441 5.1% EBIT ($m) 338 316 6.7% Gross margin (%) 23.2 22.8 42 bps Cost of doing business (%) 16.2 15.9 29 bps EBIT to sales (%) 7.1 6.9 13 bps Sales per square metre ($) 18,487 17,922 3.2% ROFE (%) 14.7 14.4 23 bps
PRE-AASB 16 NORMALISED2 H20 REPORTED3 H19 PRE-AASB 16 NORMALISED2 CHANGE
EBIT – pre-AASB 16 comparable basis 309 294 5.2% EBIT – pre-AASB 16 comparable basis to sales (%) 6.5 6.4 3 bps H20 Normalisation – pre-AASB 16
1 Normalised results and growth reflect adjustments to H19 if AASB 16 had been in place in F19 2 Normalised results and growth reflect adjustments to H20 if AASB 16 had not been in place in F20 3 Comparatives have been re-presented to reflect the transfer of the Summergate business from Endeavour Drinks to Australian Food 44
COMPANY RESULTS HALF-YEAR 2020
Dan Murphy’s highlights
H1 highlights H2’20 focus
Complete review of the wine range Delivering a localised range with 350 new lines added to stores over the last 6 months 9 new stores taking total fleet to 239. Including first Smart Store and first New Urban format in Elanora Heights Continued strong performance in VOC December Store- controllable VOC of 90, +2pts on LY Successful relaunch
memberships, up 24% vs LY 2 new stores added to the fleet to total 241 as well as trialling new store renewal formats Optimising discovery engine to help My Dan’s members discover new products that they will love Continued focus on simplification of processes for store teams through investments in technology and Workforce Planning Continue to leverage Pinnacle to deliver a product range tailored to customers Successful relaunch
app providing multiple shopping options that enhance the customer experience
45
COMPANY RESULTS HALF-YEAR 2020
BWS highlights
H1 highlights H2’20 focus
On demand delivery expanded to 740 stores driving double-digit growth New BWS APP +250k downloads supported by BWS Cooler promotion and was one of the top Food and Drinks apps New partnership with Uber launched in ~210 stores in Victoria Opened 7 net new stores bringing the total store network to 1,353 and completed 73 Renewals (including 2 Smart Stores) New product lines launched supporting double-digit sales growth
Continue the Partnership with Food promoting customers to win on value through personalised Rewards Continue to simplify store processes through in-store technology while providing authentic, knowledgeable and personalised customer experiences Further enhance curated and localised ranging enabled by new system investments Continue the H2 Renewal program aligned to Food providing customers with improved in-store experience
7
Continue the partnership with Uber by expanding the offer to additional stores in the network
46
COMPANY RESULTS HALF-YEAR 2020
Endeavour Drinks F20 priorities
Build effective and efficient operating model through shared capabilities Deliver increasingly effortless, personal and inspiring experiences. Evolve portfolio to support core and develop new growth avenues Customer 1st Brand, Team and Culture Innovate our customer and team experience Differentiate our core customer
Pinnacle integration Redesign our E2E
Dan Murphy’s Re-establish discovery through brand, range, experiences, value Pinnacle Deepen and better integrate our unique competitive advantage BWS Accelerate on convenience and localisation
To
ith h a drin inks e s experie ience they’l y’ll lo l love
COMPANY RESULTS HALF-YEAR 2020
47
Broadbeach Tavern, QLD
48
COMPANY RESULTS HALF-YEAR 2020
Hotels
REPORTED H20 POST-AASB 16 NORMALISED1 H19 POST-AASB 16 NORMALISED1 CHANGE
Sales ($m) 919 865 6.2% EBITDA ($m) 342 327 4.7% EBIT ($m) 224 207 8.3% Gross margin (%) 83.7 84.2 (57) bps Cost of doing business (%) 59.2 60.3 (105) bps EBIT to sales (%) 24.4 23.9 47 bps ROFE (%) 9.0 8.7 32 bps
PRE-AASB 16 NORMALISED2 H20 REPORTED H19 PRE-ASSB 16 NORMALISED2 CHANGE
EBIT – pre-AASB 16 comparable basis 178 161 10.8% EBIT – pre-AASB 16 comparable basis to sales (%) 19.4 18.6 80 bps H20 Normalisation – pre-AASB 16
1 Normalised results and growth reflect adjustments to H19 if AASB 16 had been in place in F19 2 Normalised results and growth reflect adjustments to H20 if AASB 16 had not been in place in F20 COMPANY RESULTS HALF-YEAR 2020
49 H20 GROUP SUMMARY & PROGRESS Brad Banducci 4 GROUP FINANCIAL RESULTS Stephen Harrison 12 BUSINESS PERFORMANCE UPDATE 24 OUTLOOK Brad Banducci 50
COMPANY RESULTS HALF-YEAR 2020
50
Outlook and focus for H2
Slower start to Q3 reflecting a volatile consumer and natural environment. Despite this we are confident in our plans for H2 Higher food inflation expected to continue in Australian and New Zealand Food. Costs to be impacted by new EAs, while continued opportunities available in productivity and total stock loss Continue to scale up of X businesses to keep pace with customers’ demands and expectations Exciting but busy second half for Endeavour Group as we progress the separation of the business. Focused on areas of strong growth potential as premiumisation trends continue Build on BIG W momentum through a focus on profitable sales with post-AASB 16 profit forecast in F20
COMPANY RESULTS HALF-YEAR 2020
51
Glossary
Cash realisation ratio Operating cash flow as a percentage of Group net profit after tax before depreciation and amortisation Comparable sales Measure of sales which excludes stores that have been opened or closed in the last 12 months and demonstrable impact on existing stores from store disruption as a result of store refurbishment or new store
Cost of doing business (CODB) Expenses which relate to the operation of the business Customer 1st Ranging Developing a clearly defined range to provide an easier shopping experience for the customer Customer fulfilment centre Dedicated online distribution centres Drive Convenient options for customers to pick up online orders through Drive up or Drive thru facilities eStore Store which utilises automation for the fulfilment of online orders Free cash flow Cash flow generated by the Woolworths Group after equity related financing activities including dividends and repayment of lease liabilities Funds employed Net assets employed excluding net tax balances MFC Micro-fulfilment centre MSRDC Melbourne South Regional Distribution Centre Net assets employed Net assets excluding net debt and other financial assets and liabilities Net Promoter Score (NPS) A loyalty measure based on a single question where a customer rates a business on a scale of zero to 10. The score is the net result of the percentage of customers providing a score of nine or 10 (promoters) less the percentage of customers providing a score of zero to six (detractors) Total Net debt Borrowings less cash balances including debt hedging derivatives and lease liabilities On-demand/express delivery An express or scheduled delivery service providing online orders at the customer's convenience Pick up A service which enables collection of online shopping orders in-store or at select locations
COMPANY RESULTS HALF-YEAR 2020
52
Glossary continued
Renewals A total store transformation focused on the overall store environment, team, range and process efficiency (including digital) Return on Funds Employed (ROFE) ROFE is calculated as EBIT before significant items for the previous 12 months as a percentage of average (opening, mid and closing) funds employed including significant items provisions Sales per square metre Total sales for the previous 12 months by business divided by average trading area Simpler for Stores Simplification of end-to-end processes for store teams, improving customer experience and productivity Smart Store A store that employs technology to improve process efficiency from customers and team members Total stock loss The value of stock written-off, wasted, stolen, cleared, marked-down or adjusted from all stores nationally (sometimes expressed as a percentage of sales) Voice of Customer (VOC) Externally facilitated survey of a sample of Woolworths Group customers where customers rate Woolworths Group businesses on several criteria. Expressed as the percentage of customers providing a rating of six or seven on a seven-point scale VOC NPS VOC NPS is based on feedback from Woolworths Rewards members. VOC NPS is the number of promoters (score of nine or 10) less the number of detractors (score of six or below) Voice of Supplier (VOS) A survey of a broad spectrum of suppliers facilitated by an external provider. The survey is used to provide an ongoing measure of the effectiveness of business relationships with the supplier community. VOS is the average of the suppliers’ rating across various attributes scored as a percentage of suppliers that provided a rating of six or seven on a seven-point scale Voice of Team (VOT) Survey measuring sustainable engagement of our team members as well as their advocacy of Woolworths as a place to work and shop. The survey consists of nine sustainable engagement questions, three key driver questions and two advocacy questions
COMPANY RESULTS HALF-YEAR 2020
53
Glossary
Other non-IFRS measures used in describing the business performance include:
COMPANY RESULTS HALF-YEAR 2020
54
Disclaimer
This presentation contains summary information about Woolworths Group Limited (Woolworths Group) and its activities current as at the date of this presentation. It should be read in conjunction with Woolworths’ other periodic and continuous disclosure announcements filed with the Australian Securities Exchange, available at www.asx.com.au This presentation has not been audited in accordance with Australian Auditing Standards. This presentation contains certain non-IFRS measures that Woolworths Group believes are relevant and appropriate to understanding its
This presentation is for information purposes only and is not a prospectus or product disclosure statement, financial product or investment advice or a recommendation to acquire Woolworths Group shares or other securities. It has been prepared without taking into account the
appropriateness of the information having regard to their own objectives, financial situation and needs and seek legal and taxation advice appropriate to their jurisdiction. Past performance is no guarantee of future performance. No representation or warranty, expressed or implied, is made as to the fairness, accuracy, completeness or correctness of the information,
bodies corporate, or their respective directors, employees or agents, nor any other person accepts liability for any loss arising from the use
This presentation may contain forward-looking statements including statements regarding our intent, belief or current expectations with respect to Woolworths Group’s business and operations, market conditions, results of operations and financial condition, specific provisions and risk management practices. When used in this presentation, the words ‘plan’, ‘will’, ‘anticipate’, ‘expect’, ‘may’, ‘should’ and similar expressions, as they relate to Woolworths Group and its management, are intended to identify forward-looking statements. Forward looking statements involve known and unknown risks, uncertainties and assumptions and other important factors that could cause the actual results, performances or achievements of Woolworths Group to be materially different from future results, performances or achievements expressed or implied by such statements. Readers are cautioned not to place undue reliance on these forward-looking statements, which speak only as of the date thereof.
COMPANY RESULTS HALF-YEAR 2020
55