18 Holes of Governance Board Governance at the Turn Pat McGurn ISS - - PowerPoint PPT Presentation

18 holes of governance
SMART_READER_LITE
LIVE PREVIEW

18 Holes of Governance Board Governance at the Turn Pat McGurn ISS - - PowerPoint PPT Presentation

1 18 Holes of Governance Board Governance at the Turn Pat McGurn ISS Governance Analytics 11/7/17 2 Todays Foursome Handicaps and Course Rules Playing from the Black Tees: S&P 500 Firms (Large Caps) Average Board Size in


slide-1
SLIDE 1

1

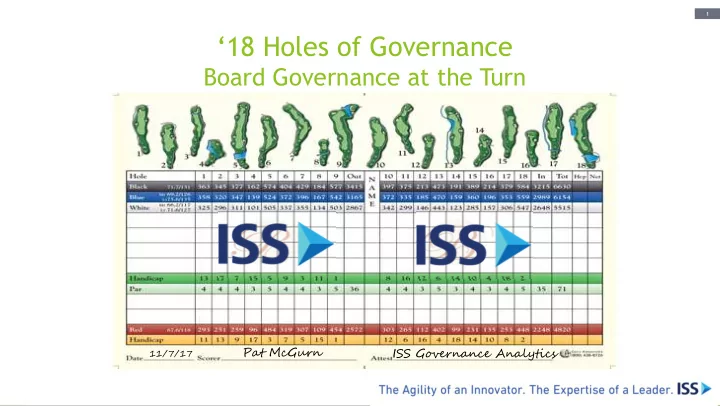
‘18 Holes of Governance

Board Governance at the Turn

Pat McGurn

11/7/17

ISS Governance Analytics

slide-2
SLIDE 2

2

Today’s Foursome Handicaps and Course Rules

Playing from the Black Tees: S&P 500 Firms (Large Caps)

Average Board Size in 2017 (YTD): 11.1 seats

Playing from the Blue Tees: S&P 400 Firms (Middle Market)

Average Board Size in 2017 (YTD): 9.7 seats

Playing from the Red Tees: S&P 600 Firms (Small Caps)

Average Board Size in 2017 (YTD): 8.5 seats

Playing from WTDWP: Recent IPOs/Emerging Growth Companies

Average Board Size (2016): 7.1 seats at time of closing

Front Nine ISG Rules: Investor Stewardship Group

ISG is a collective of some of the largest U.S.-based institutional investors and global asset managers (including Blackrock, State Street Global Advisers and Vanguard). The members are a group of 38 U.S. and international institutional investors that in aggregate invest over $20 trillion in the U.S. equity markets. The framework goes into effect Jan. 1, 2018.

Back Nine Rules: Emerging Issues and Future Concerns

Three near-term, three mid-term and three long-term

slide-3
SLIDE 3

3

82.5

82.7 83.1 83.3 83.1

83 78.8

79 79.5 80.3 80.5

79.8 77.2

77.7 78.4 78.2 77.8

78.2 75 76 77 78 79 80 81 82 83 84 2012 2013 2014 2015 2016 2017 % Most Board Have Only One or Two Directors Who Are Not Independent S&P 500 S&P 400 S&P 600

3

Hole 1 (Par 4) Average Board Independence

ISG 5.2—A majority of directors on the board should be independent. Source: ISS Governance Analytics IPOs: 60-75% independent, but just 85% have majority independent boards at pricing.

slide-4
SLIDE 4

4

91.4

91.8 91.4 91.2 93.1

88 90.4

91.2 91.9 93 92.4

[VALUE] 86.9

87.3 88.9 85.6 84.7

[VALUE] 80 82 84 86 88 90 92 94 2012 2013 2014 2015 2016 2017 % Prevalence of Independent Nominating Panels High, But Dropping S&P 500 S&P 400 S&P 600

4

Hazard: % with Independent Nominating/Governance Panels

ISG 5.3—Boards should establish committees to which they delegate certain tasks to fulfill their oversight responsibilities. Source: Governance Analytics Hazards: IPO Phase-in and controlled company exemption

slide-5
SLIDE 5

5

51

52.5 56 55.9 58.2

64.3 49.8

51.5 51.9 53.3 53.1

53.9 30 40 50 60 70 80 90 100

2012 2013 2014 2015 2016 2017

% Hazard: Supermajority Vote Requirements to Amend Charters Slow Reform S&P 500 S&P 400 S&P 600

5

Hole 2 (Par 4) Annual Elections of All Board Members

ISG 1.2—Requiring directors to stand for election annually helps increase their accountability to shareholders. Source: Governance Analytics IPOs: >70% have classified boards

slide-6
SLIDE 6

6

78.3

81.8 85.3 87.4 89.6

90.9 42.4

47 56.2 60.4 63.6

64 21.6

25.7 27.8 32.6 39.6

46.1 20 40 60 80 100 2012 2013 2014 2015 2016 2017 % Governance Gap Shrinks as Investors Prod Board to Amend Bylaws S&P 500 S&P 400 S&P 600

6

Hole 3 (Par 4): Majority Voting In Uncontested Elections

ISG 1.3—Individual directors who fail to receive a majority of the votes cast in an uncontested election should tender their resignation. The board should accept the resignation or provide a timely, robust, written rationale for not accepting the resignation. Source: Governance Analytics IPOs: >65% with MTV

slide-7
SLIDE 7

7

0.4 35.2

63.2

0.5 6.8

15.4

1.7

5.2 10 20 30 40 50 60 70 2012 2013 2014 2015 2016 2017 % Rapid Rate of Adoption Leads to Big Governance Gap S&P 500 S&P 400 S&P 600

7

Hole 4 (Par 3) Proxy Access for Board Nominees

ISG 1.4—Shareholders who own a meaningful stake in the company and have owned such stake for a sufficient period of time should have, in the form of proxy access, the ability to nominate directors to appear on the management ballot at shareholder meetings. Source: Governance Analytics IPOs: >70% have access rules

slide-8
SLIDE 8

8

21.7

22.4 25.3 26.5 26.8

29.9 30.4

29.3 35 34.7 37.1

36.6 33.3

36 38.4 39.4 40.7

45.7 20 25 30 35 40 45 50 2012 2013 2014 2015 2016 2017 % Small-Caps Lead the Way: Governance Gap Moves In the Opposite Direction S&P 500 S&P 400 S&P 600

8

Hole 5 (Par 5) Independent Board Chairs

ISG 4.2—Some investor signatories believe that independent board leadership requires an independent chairperson, while others believe a credible independent lead director also achieves this objective. Source: Governance Analytics

slide-9
SLIDE 9

9

57.2

56.8 52.7 52 49.1

47.7 45

43.9 43.3 40.2 38.4

38 44.9

41.6 39.6 39.7 35.2

31.1 20 25 30 35 40 45 50 55 60 2012 2013 2014 2015 2016 2017 % Combining Top Two Titles is No Longer The Norm S&P 500 S&P 400 S&P 600

9

Combined CEO/Chairs

Source: Governance Analytics IPOs: 40% Combine Hazard: Relay succession planning

slide-10
SLIDE 10

10

67.5

67.7 66.5 66.8 67.4

67.9 52

55.4 52.9 55.7 56.6

58.6 44.6

46.6 47.1 46.1 45.5

45.4 40 45 50 55 60 65 70 2012 2013 2014 2015 2016 2017 % Popularity of Compromise Leadership Structure Points to Continuing Change S&P 500 S&P 400 S&P 600

10

Hazard: Independent Lead Directors

ISG 4.3—The role of the independent board leader should be clearly defined and sufficiently robust to ensure effective and constructive leadership. The responsibilities of the independent board leader and the executive chairperson (if present) should be agreed upon by the board, clearly established in writing and disclosed to shareholders. Source: Governance Analytics

slide-11
SLIDE 11

11

8.62

8.73 8.7 8.64 8.44

8.18 9.61

9.59 9.46 9.34 8.96

8.76 9.57

9.74 9.66 9.64 9.2

8.65 8 8.2 8.4 8.6 8.8 9 9.2 9.4 9.6 9.8 10 2012 2013 2014 2015 2016 2017 Tenure (Yrs.) Surge of New Directors Lowers Average Board Tenure S&P 500 S&P 400 S&P 600

11

Hole 6 (Par 4) Refreshment: Average Tenure (Director Level Data)

ISG 5.7—Boards should disclose mechanisms to ensure there is appropriate board refreshment. Source: Governance Analytics

slide-12
SLIDE 12

12

61.5

61.9 62.2 62.4 62.3

62.5 61.4

61.8 62.1 62.4 62.7

62.8 60.8

61.3 61.6 62.2 62.2

62.1 59.5 60 60.5 61 61.5 62 62.5 63 2012 2013 2014 2015 2016 2017 Age (Yrs.) Board Aging Process Slowed By Recent Refreshment S&P 500 S&P 400 S&P 600

12

Hole 7 (Par 4) Refreshment: Average Age (Director Level Data)

ISG 5.7—Boards should disclose mechanisms to ensure there is appropriate board refreshment. Source: Governance Analytics

slide-13
SLIDE 13

13

16.2

17 18.6 19.7 21.1

22.3 12.5

13.5 14.7 16 16.9

18.2 10

10.8 12 12.8 14.3

15.4 8 10 12 14 16 18 20 22 24 2012 2013 2014 2015 2016 2017 % Slow, Steady Progress on Gender Diversity S&P 500 S&P 400 S&P 600

13

Hole 8 (Par 3) % of Women on Boards (Average of company-level data)

ISG 5.1—Boards should be composed of directors having a mix of direct industry expertise and experience and skills relevant to the company’s current and future strategy. In addition, a well-composed board should also embody and encourage diversity, including diversity of thought and background. Source: Governance Analytics

slide-14
SLIDE 14

14

12.2

12.2 12.9 13.4 13.6

13.9 8.4

8.2 8.5 8.8 8.7

9.7 7.1

7.3 7 7.1 7.3

7.5 6 7 8 9 10 11 12 13 14 15 2012 2013 2014 2015 2016 2017 % Glacial Progress on Racial and Ethnic Diversity S&P 500 S&P 400 S&P 600

14

Hole 9 (Par 5) % of Minority Directors on Boards (Average company-level data)

ISG 5.1—A well-composed board should also embody and encourage diversity, including diversity of thought and background. Source: Governance Analytics

slide-15
SLIDE 15

15

Hole 10 (Par 4) Focus on Gender Diversity Will Grow in 2018

30 Percent Women on Boards? Unrealistic or Already Reality? 31.7% 27.3% 26.4% 25.2% 22.3% 22.3% 14.5%

30%

0.0% 5.0% 10.0% 15.0% 20.0% 25.0% 30.0% 35.0% STOXX Europe 600 (ex. FTSE 350) FTSE 100 TSX 60 ASX200 S&P 500 FTSE 350 (ex. FTSE 100) Russell 3000 (ex S&P 500) Percentage of Directorships Held by Women

slide-16
SLIDE 16

16

ISS 2017-18 Survey: Gender Diversity

Does your organization consider it to be problematic if there are zero female directors on a public company board? 43 26 8 24 25 29 19 27 5 10 15 20 25 30 35 40 45 50 Yes Yes, but concerns may be mitigated by policy. No Case-by-case determination % Investors Companies

slide-17
SLIDE 17

17

ISS 2017-18 Survey: Gender Diversity

What actions do you consider may be appropriate for shareholders to take at a company that lacks any gender diversity on the board, and/or has not disclosed a policy on the issue? (Check all that apply) Action Investors’ Rank Engage with board/management #1 (71) Consider supporting shareholder proposal #2 (64) Consider supporting a shareholder-nominated board candidate #3 (46) Consider vote against chair of the nominating/governance committee #4 (41) Consider votes against nominating/governance committee #5 (34)

slide-18
SLIDE 18

18

Hole 11 (Par 4) Enter the Board Matrix

18

  • Boardroom Accountability

Project campaign 2.0 wants to make boards more diverse, independent, and climate-competent.

  • Comptroller Stringer/NYC

Pension Funds called on >150 boards to disclose directors’ race, gender and skills in a standardized “matrix” format and to enter into a dialogue.

  • In 2015, NYC Funds — along

with eight other major U.S. pension systems — submitted a rulemaking petition to the SEC asking to make this type of disclosure mandatory market-wide. Source:

slide-19
SLIDE 19

19

Hole 12 (Par 3) CEO Pay Ratio

  • Nearly two-thirds (63%) of investors indicated they plan to use the new CEO pay ratio
  • Comparing ratios across companies/industry sectors
  • Assessing year-over-year changes at an individual company
  • Investors said they will use the information for…
  • Considering votes on compensation proposals
  • Background when engaging with issuers
  • Considering votes on directors
  • Only 16% of investors indicated that they have no plan to use the data
slide-20
SLIDE 20

20

Hole 13 (Par 5) ESG Issues on Rise

Environmental Issues Emerge as Leading E&S Concern

121 30 26 139 40 58 125 61 31 123 35 41 137 57 29 110 30 22

136 97 37 101 27 24

20 40 60 80 100 120 140 160

Environment (inc. climate change) Labor (inc. Workforce Diversity, Gender Pay Equity, Pay Disparity) Board Diversity Political Issues Human Rights Sustainability Reporting

Number of Resolutions Filed for Top 6 E&S Issues

2017 data as of August 28, 2017

2014 2015 2016 2017

slide-21
SLIDE 21

21

Focus on Climate Change Risk

Recent Growth in Climate Change Proposals in US 17 68 68 91 88 5 35 23 30 31 11 30 43 54 49 22.8% 23.8% 20.9% 23.3% 27.9% 0.0% 5.0% 10.0% 15.0% 20.0% 25.0% 30.0% 35.0% 10 20 30 40 50 60 70 80 90 100 2013 2014 2015 2016 2017 Climate Change Resolutions 2013-2017

2017 Data as of August 28, 2017

Filed Withdrawn Voted On Avg Support

slide-22
SLIDE 22

22

Hole 14 (Par 3) Virtual Only Annual Meetings

ISS 2017-18 Survey: Please describe your organization's view on the use of remote means of communication for facilitating shareholder participation at general meetings, i.e., "hybrid" or "virtual-only" shareholder meetings.

22

19 36 32 7 5 42 9 22 15 2 5 10 15 20 25 30 35 40 45

My organization generally considers the practice of holding "virtual-only" or "hybrid" shareholder meetings to be acceptable. My organization generally considers the practice of holding "hybrid" shareholder meetings to be acceptable, but not "virtual-only" shareholder meetings. My organization generally considers the practice of holding "hybrid" shareholder meetings to be acceptable, and would also be comfortable with "virtual-

  • nly" shareholder meetings if

they provided the same shareholder rights as a physical meeting. My organization does not support the practice of holding "hybrid" or "virtual" shareholder meetings. Other (please specify)

% Investors Companies

slide-23
SLIDE 23

23

Hole 15 (Par 4) Focus on One Share, One Vote

  • SNAP’s zero voting right IPO sparks major investor backlash
  • Stock exchanges race to the bottom in pursuit of high-profile listings
  • Hong Kong & Singapore consider relaxing bans on unequal voting rights
  • London wooing Saudi Aramco
  • Investors lobby index providers – with some success
  • Will index providers emerge as new governance arbiters?
  • Some investors appear open to unequal voting rights with a clear sunset
  • Other issues for post-IPO boards—staggered terms and supermajority votes
  • Issues for other boards—bylaw amendments and “placeholder” nominee bans
slide-24
SLIDE 24

24

ISS 2017-18 Survey: One Share One Vote

Which of the following represents your organization's view of multi-class capital structures with unequal voting rights? 5 43 17 7 18 10 50 11 9 5 13 12 10 20 30 40 50 60 Companies free to choose. Never appropriate for public company. Sunset based

  • n time

elapsed since the IPO. Sunset based

  • n the market

capitalization

  • f the

company. Require periodic reapproval low-vote share holders. Other (please specify) % Investors Companies

slide-25
SLIDE 25

25

Hole 16 (Par 3) Risk Oversight

  • Risk oversight failures drive large “no” votes against directors and opposition to say on pay
  • 2017: Wells Fargo (fake accounts), Mylan NV (EpiPen pricing) and McKesson (opioid crisis)
  • 2018: Equifax (cyber security), Insys Therapeutics (opioid scandal)…
  • Key steps taken upon discovery of problem
  • Speedy disclosure (materiality)
  • Independent investigation by board or third party
  • Actions taken by boards in wake of scandals
  • Executive turnover
  • Clawbacks implemented for senior executives (reputational damage)
  • Director exits and arrivals
  • Boardroom leadership and key committee membership changes
  • New committees focused on risk oversight
slide-26
SLIDE 26

26

Hole 17 (Par 4) Performance Pay in the Spotlight

Increased scrutiny on goal setting and rigor 10% 24% 86% 70% S&P 500 R3K Discretionary Bonus vs. Performance Cash* Bonus Non-Equity Incentive Plan 28% 45% 50% 52% 53% 56% 72% 55% 50% 48% 47% 44% 0% 20% 40% 60% 80% 2011 2012 2013 2014 2015 2016 Performance-Vested vs. Time-Vested Equity (S&P 500)*

Performance-Based Equity Time-Vested Equity

*Source: ISS ExecComp Analytics

slide-27
SLIDE 27

27

IRRCi/ISS Board Refreshment Study

27

Hole 18 (Par 5): Potential Refreshment Pitfalls

slide-28
SLIDE 28

28

S&P 1500: >50% of Boards Add “New” Members

More than one-half of boards refreshed in 2015 and 2016

66.2% 68.6% 69.7% 67.1% 61.8% 55.9% 52.8% 49.6% 48.6% 26.2% 24.0% 22.4% 25.6% 29.6% 33.9% 37.3% 41.0% 41.9% 5.1% 4.3% 3.6% 3.8% 5.1% 6.1% 8.0% 8.2% 9.4% 1.9% 1.9% 2.0% 1.7% 1.9% 3.0% 3.5% 4.0% 4.3% 0% 0.4% 0.5% 0.5% 0.6% 0.9% 1.2% 1.2% 1.5% 0% 10% 20% 30% 40% 50% 60% 70% 80% 2008 2009 2010 2011 2012 2013 2014 2015 2016 YTD % of firms 0% 10+% 25+% 33.3+% 50+% % of Board New:

slide-29
SLIDE 29

29

S&P 1500: Refreshment Rate Grows After Lull

 “Rising” directors lose share to new/recent nominees and long-serving board members

5.2% 4.9% 4.7% 5.1% 6.1% 7.5% 8.1% 8.9% 9.5% 25.7% 24.6% 23.6% 20.7% 19.4% 19% 19.9% 21.2% 22.9% 35.9% 36.9% 37.6% 38.9% 38.4% 36.6% 34.1% 31.6% 29.6% 15.9% 15.9% 16.1% 17.1% 17.1% 18% 18.9% 19.4% 19.3% 17.3% 17.7% 18.0% 18.3% 18.9% 19% 19% 18.9% 18.7% 0% 5% 10% 15% 20% 25% 30% 35% 40% 2008 2009 2010 2011 2012 2013 2014 2015 2016 YTD % of board seats 1 to 3 4 to 9 10 to 14 15+

Tenure (years):

IRRCi/ISS Board Refreshment Study

slide-30
SLIDE 30

30

S&P 1500: Directors in 50s and 60s Dominate

 Board members in 70s and 80s gain bigger shares of seats; sub-50 directors lose slots

10.8% 9.9% 8.9% 8.1% 7.5% 6.8% 6.4% 6.3% 6.1% 31.7% 30.9% 30.7% 30.4% 30.1% 30% 29.8% 29.7% 29.5% 44.5% 45.4% 45.7% 45.7% 45.2% 44.4% 43.7% 43.8% 44.1% 11.7% 12.6% 13.3% 14.3% 15.6% 17% 18.3% 18.4% 18.6% 1.2% 1.3% 1.5% 1.5% 1.7% 2% 1.6% 1.9% 1.8% 0% 5% 10% 15% 20% 25% 30% 35% 40% 45% 50% 2008 2009 2010 2011 2012 2013 2014 2015 2016 YTD % of board seats < 50 50s 60s 70s 80+ Age (years):

IRRCi/ISS Board Refreshment Study

slide-31
SLIDE 31

31

Refreshment Toolbox

31

IRRCi/ISS Board Refreshment Study