
SLIDE 1
1 2yxwvutsrqponmlkihgfedcbaYUTSRQPONMLIHGFEDCBA
4/7/2017
Yolo Bypass Salmonid Habitat Restoration & Fish Passage
Environmental Impact Statement Environmental Impact Report April 5, 2017
State of California Department of Water Resources
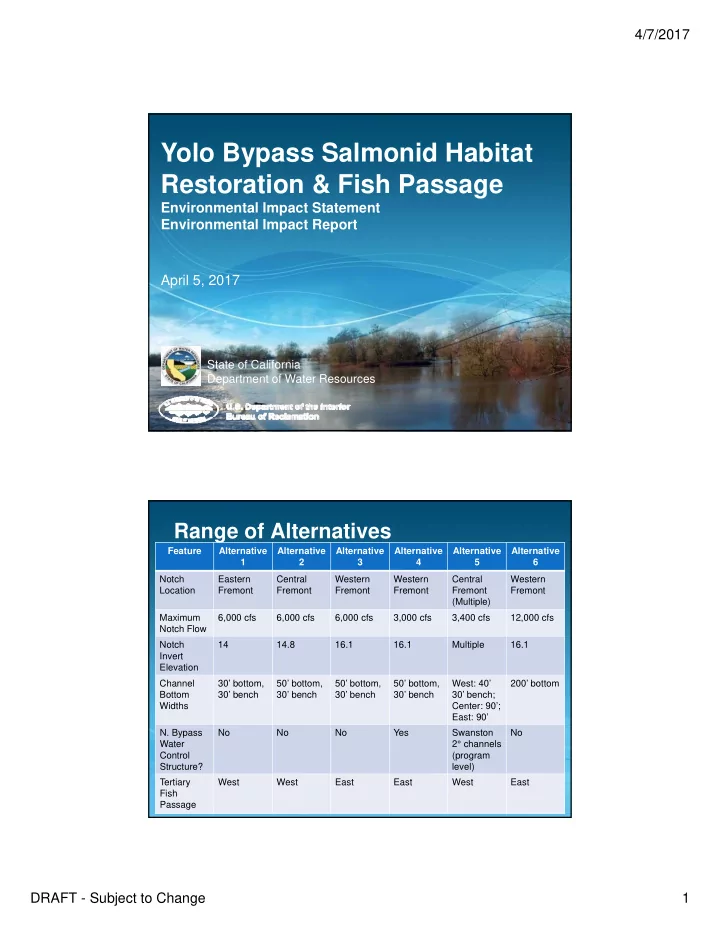
Range of Alternatives
Feature Alternative 1 Alternative 2 Alternative 3 Alternative 4 Alternative 5 Alternative 6 Notch Location Eastern Fremont Central Fremont Western Fremont Western Fremont Central Fremont (Multiple) Western Fremont Maximum Notch Flow 6,000 cfs 6,000 cfs 6,000 cfs 3,000 cfs 3,400 cfs 12,000 cfs Notch Invert Elevation 14 14.8 16.1 16.1 Multiple 16.1 Channel Bottom Widths 30’ bottom, 30’ bench 50’ bottom, 30’ bench 50’ bottom, 30’ bench 50’ bottom, 30’ bench West: 40’ 30’ bench; Center: 90’; East: 90’ 200’ bottom
- N. Bypass
Water Control Structure? No No No Yes Swanston 2° channels (program level) No Tertiary Fish Passage West West East East West East