
SLIDE 1
30 35 40 45 50 55 60 65 70 75 80 85 90 95 100
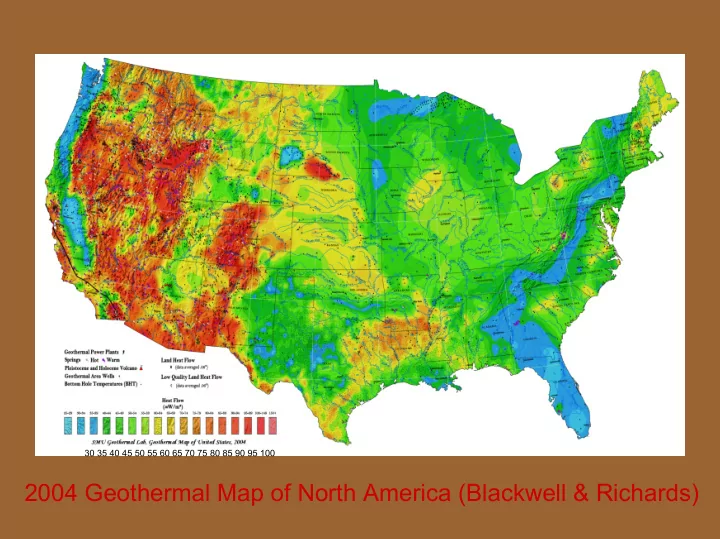
2004 Geothermal Map of North America (Blackwell & Richards) All - - PowerPoint PPT Presentation
30 35 40 45 50 55 60 65 70 75 80 85 90 95 100 2004 Geothermal Map of North America (Blackwell & Richards) All data sites for US heat flow map including sites of wells with BHT data in the AAPG data base. BHT symbols are based on depth and
30 35 40 45 50 55 60 65 70 75 80 85 90 95 100
Heat flow and BHT sites
All data sites for US heat flow map including sites of wells with BHT data in the AAPG data base. BHT symbols are based on depth and temperature. The named wells are the BHT calibration points.
CALCULATION OF TEMPERATURE AT DEPTH
Input values: Surface heat flow (Q0), Mantle heat flow (Qm), Thermal conductivity for sediments (Ks), Sediment thickness (XS), Surface temperature (T0), Surface sediments (As), Surface basement (Ab), Radioactive layer (r).
Sediment Contribution Basement Contribution
S S S S S S
K X A K X Q T
2
− =
b r x b b m b
K e r A K Q T
b
−
− − = 1
2
Where As=1 µW/m3 Where Ab=(Qbelow_sediments-Qm)/r
T=Ts+Tb
Temperature at depth
Tfinal=T+T0
Correct for surface temperature
For 3 and 4 km Ks was from BHT data; below 4km KS=Kb=2.6; For most of the U.S. r = 10 km. If sediment thickness exceeds 3 km then r = 13-XS (Sediment thickness)
[ ]
[ ]
sgw i p i i p i
T T V C T V C Q − = ∆ = ρ ρ
Flow chart for calculation
content at depth. Note: 1 kW-sec = 1 kJ and angle brackets denote depth-averaging.
Sediment thickness map (in meters, modified from AAPG Basement Map of North America, 1978). The 4 km depth contour is outlined with a bold black line. Low-conductivity regions in the western United States are in blue/green.
4 °C 6 °C 8 °C 10 °C 12 °C 14 °C 16 °C 18 °C 20 °C 22 °C 24 °C 26 °C
Mantle Heat Flow 60 mW/m2
Map of surface temperature (colors, Gass, 1982) and generalized mantle heat flow for the conterminous US (dotted area inside heavy black line is greater than 60 mW/m2, the remainder of the area is 30 mWm2)
Surface Gradient
Temperatures at 4.5, 6.5 and 10 km Depths
Temperatures at depths of 2 to 5 km in The Geysers/ Clear Lake thermal area (Erkan et al., 2005)
Estimated total geothermal resource base and recoverable resource given in EJ or 10+18 Joules.
1,000,000 EJ 10,000 x US use
Histograms of heat content in EJ, as a function of depth for 1 km slices.
Histograms of US area at a given temperature, as a function of depth for 1 km slices.
Table 1.1 Estimated U.S. geothermal resource base to 10 km depth by category Category of Resource Thermal Energy, in Exajoules (1EJ = 1018 J) Reference Conduction-dominated EGS Sedimentary rock formations >100,000 This study Crystalline basement rock formations 13,900,000 This study Supercritical Volcanic EGS* 74,100 USGS Circular 790 Hydrothermal 2,400 – 9,600 USGS Circulars 726 and 790 Coproduced fluids 0.0944 – 0.4510 McKenna, et al. (2005) Geopressured systems 71,000 – 170,000** USGS Circulars 726 and 790 * Excludes Yellowstone National Park and Hawaii ** Includes methane content
Remember 100 EJ =US 1 year use
SOUTHWESTERN ENERGY COMPANY
Improved Drilling and Production Results
2000 FINA Avg – 55 Days
Coproduced Geothermal Energy Potential
Depth to Geopressure in Km And Fairway locations
State Goal State RPS ☼ Minimum solar or customer-sited requirement * Increased credit for solar ¹PA: 8% Tier I, 10% Tier II (includes non-renewable sources)
☼ PA: 18%¹ by 2020
☼ NJ: 20% by 2020
CT: 10% by 2010 MA: 4% by 2009 + 1% annual increase WI: requirement varies by utility; 10% by 2015 Goal
IA: 105 MW
MN: 10% by 2015 Goal + Xcel mandate of 1,125 MW wind by 2010
TX: 5,880 MW by 2015 *NM: 10% by 2011 ☼ AZ: 1.1% by 2007 CA: 20% by 2010 ☼ NV: 20% by 2015
ME: 30% by 2000
*MD: 7.5% by 2019 HI: 20% by 2020 RI: 15% by 2020 ☼ CO: 10% by 2015 ☼ DC: 11% by 2022
☼ NY: 24% by 2013 MT: 15% by 2015
*DE: 10% by 2019 IL: 8% by 2013 VT: RE meets load growth by 2012
DSIRE: www.dsireusa.org April 2006