2019 Top Markets Report Methodology and Projected Priority Markets - - PowerPoint PPT Presentation

2019 top markets report methodology and projected
SMART_READER_LITE
LIVE PREVIEW

2019 Top Markets Report Methodology and Projected Priority Markets - - PowerPoint PPT Presentation

2019 Top Markets Report Methodology and Projected Priority Markets Office of Energy and Environmental Industries Industry & Analysis International Trade Administration U.S. Department of Commerce May 15, 2019 International Trade


slide-1
SLIDE 1

2019 Top Markets Report Methodology and Projected Priority Markets

Office of Energy and Environmental Industries Industry & Analysis International Trade Administration U.S. Department of Commerce May 15, 2019

International Trade Administration U.S. Department of Commerce

1

slide-2
SLIDE 2

e e

ET Top Markets Report Components

Individual Medium Score Where is the U.S. Competitive? What world markets are the largest? What markets are growing the fastest both absolutely and for U.S. Exports? Where should the U.S. be doing better? U.S. Exports Averag Annual Growth World Imports Averag Annual Growth Predicted U.S. Exports 2020 10 Water Score APC Score Waste Score

Composite ET Score

2 U.S. Department of Commerce | International Trade Administration

slide-3
SLIDE 3

2017 report available now at: trade.gov/topmarkets

3 U.S. Department of Commerce | International Trade Administration

2019 Projected Priority Markets for Environmental Technologies

slide-4
SLIDE 4

U.S. Department of Commerce | International Trade Administration

2019 Projected Priority Markets for Environmental Technologies

  • The United States hosts the largest single market for environmental

technologies (ET)

  • 10.4%: Estimated CAGR for India’s ET Market (2009‐2019)
  • $77 billion: Estimated size of China’s ET Market in 2019
  • Of the projected “top” 25 priority markets:
  • 9 are in Asia
  • 5 are in Central or

South America

  • 4 are in the Gulf Region
  • 4 are in Africa
  • 3 are in Europe

Sample CAGR Graph (India) 4

slide-5
SLIDE 5

U.S. Department of Commerce | International Trade Administration

2019 Projected Priority Markets for Environmental Technologies

1 COMPOSITE SCORE China 100.0 Mexico 88.0 Brazil 34.4 Korea 32.1 Vietnam 30.1 India 29.3 Indonesia 29.3 Saudi Arabia 28.2 Turkey 26.8 Colombia 14.3 United Arab Emirates 13.6 Thailand 11.8 Singapore 11.7 Egypt 11.0 Malaysia 10.4 Chile 10.0 Nigeria 8.5 Peru 8.5 Algeria 8.0 Angola 7.0 Belarus 5.7 Oman 5.4 Israel 4.8 Macedonia 4.7 Bangladesh 4.2 1 WATER RANKING China 51.5 India 16.5 Saudi Arabia 14.8 Mexico 13.9 Brazil 12.0 Vietnam 10.9 Colombia 10.2 Indonesia 9.1 Korea 7.6 Thailand 7.5 United Arab Emirates 7.2 Malaysia 7.1 Angola 6.2 Chile 14 6.1 Singapore 5.9 Peru 5.8 Algeria 4.7 Macedonia 4.2 Oman 3.7 Nigeria 3.5 Turkey 3.5 Egypt 3.3 Ghana 3.3 Belarus 2.8 Bangladesh 2.5 1 AIR RANKING Mexico 72.3 China 43.4 Korea 23.3 Turkey 20.4 Brazil 19.2 Vietnam 15.8 Indonesia 13.6 Saudi Arabia 10.4 India 10.1 Egypt 6.5 Nigeria 5.0 Singapore 4.4 United Arab Emirates 4.1 Chile 14 3.7 Colombia 3.3 Israel 2.9 Algeria 2.6 Malaysia 2.6 Peru 2.4 Oman 1.6 Belarus 1.6 Dominican Republic 1.4 Thailand 1.3 Bangladesh 1.0 Philippines 0.9 1 2 2 2 2 3 3 3 3 4 4 4 4 5 5 5 5 6 6 6 6 7 7 7 7 8 8 8 8 9 9 9 9 10 10 10 10 11 11 11 11 12 12 12 12 13 13 13 13 14 15 15 15 15 16 16 16 16 17 17 17 17 18 18 18 18 19 19 19 19 20 20 20 20 21 21 21 21 22 22 22 22 23 23 23 23 24 24 24 24 25 25 25 25 WASTE RANKING Indonesia 6.6 China 5.1 Vietnam 3.4 Brazil 3.2 Saudi Arabia 3.0 Thailand 2.9 Turkey 2.9 India 2.7 United Arab Emirates 2.3 Mexico 1.7 Singapore 1.4 Belarus 1.3 Korea 1.3 Egypt 14 1.2 Qatar 1.0 Colombia 0.8 Algeria 0.7 Bangladesh 0.7 Malaysia 0.7 Ethiopia 0.4 Ivory Coast 0.4 Pakistan 0.3 Philippines 0.3 Peru 0.3 Sri Lanka (Ceylon) 0.3

5

slide-6
SLIDE 6

U.S. Department of Commerce | International Trade Administration

Reference: Proxy HS Codes

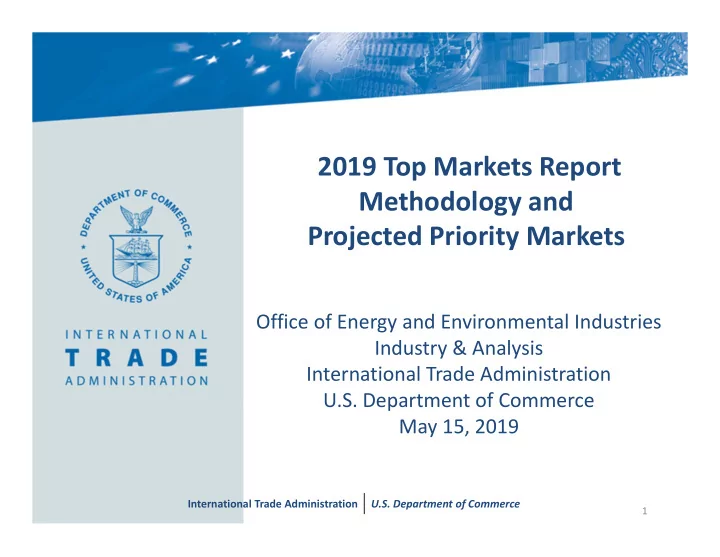
U.S. Export Analysis ‐ U.S. FAS/FOB World Import Analysis ‐ UN CIF 10‐Digit Explanation 6‐Digit Explanation 8421210000 WATER FILTERING OR PURIFYING MACHINERY & APPARATUS 842199 FILTER/PURIFY MACHINE & APPARATUS PARTS 8421990080 8421990040 PARTS OF MACH & APPARAT;FILT;PURIFY;LIQ;GAS;NESOI PARTS OF FILTERING OR PURIFYING APPARATUS 842121 WATER FILTERING OR PURIFYING MACHINERY & APPARATUS 9027100000 GAS OR SMOKE ANALYSIS APPARATUS 902710 GAS OR SMOKE ANALYSIS APPARATUS 8421398090 8421398015 8421394000 8421398040 8421398030 8421398005 8421398020 8421398060 FILTERING OR PURIFYING MACH & APPARATUS;GAS; NESOI DUST COLLECTION AND AIR PURIFICATION EQUIP; NESOI CATALYTIC CONVERTERS GAS SEPARATION EQUIPMENT INDUSTRIAL GAS CLEANING EQUIPMENT; NESOI DUST COLLECT AND AIR PURIFI EQUIP FOR MACH TOOLS ELECTROSTATIC PRECIPITATORS; IND GAS CLEAN EQUIP PNEUMATIC FLUID POWER FILTERS RATED GT/= 550 KPA 842139 FILTER/PURIFY MACHINE & APPARATUS FOR GASES NESOI 8479820080 CRUSH;GRIND;SCREEN;SIFT;EMULSFYG;ETC MACH;NESOI 847982 Mixing, kneading, crushing, grinding, screening, sifting, homogenizing, emulsifying or stirring machines 6