
SLIDE 1
Chapter 10: Competition in large communities
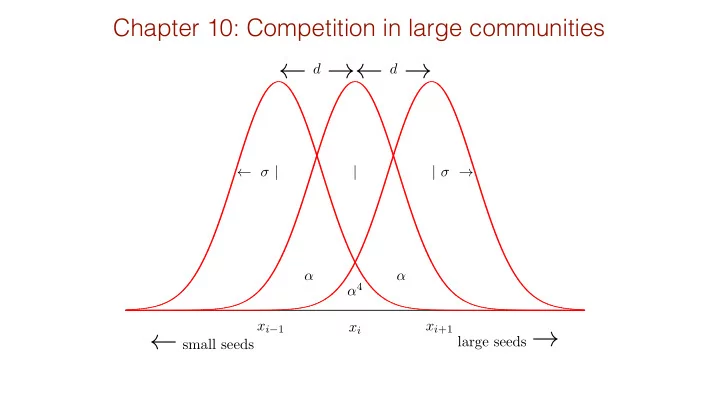
→ ← d ← →
d ← σ | | | σ → xi−1 xi xi+1 α α α4 large seeds →
| | | 4 x i 1 x i +1 x i large seeds small seeds - - PowerPoint PPT Presentation
Chapter 10: Competition in large communities d d | | | 4 x i 1 x i +1 x i large seeds small seeds Niche space model 2 2 e [ x d ]2 e x 2 R d x 2 2 2 2 e
d ← σ | | | σ → xi−1 xi xi+1 α α α4 large seeds →
α = R ∞
−∞ e− x2
2σ2 × e− [x−d]2 2σ2
dx R ∞
−∞ e− x2
2σ2 × e− x2 2σ2 dx
= e−( d
2σ) 2
2σ) 2
2σ) 2
n
j=1
dN1 dt = rN1(1 − N1 − αN2) and dN2 dt = rN2(1 − N2 − αN1)
<latexit sha1_base64="(nul)">(nul)</latexit><latexit sha1_base64="(nul)">(nul)</latexit><latexit sha1_base64="(nul)">(nul)</latexit><latexit sha1_base64="(nul)">(nul)</latexit> model ← function(t, state, parms) { with(as.list(c(state,parms)), { N ← state S ← A %*% N # R code for matrix x vector multiplication dN ← r*N*(1 − S) return(list(dN)) }) } makeMatrix ← function(alpha) { seqAlpha ← sapply(seq(from=0,n−1),function(i){alpha^(i^2)}) A ← matrix(0,nrow=n,ncol=n) for (i in seq(n)) { A[i,i:n] ← seqAlpha[1:(n−i+1)] A[i,1:i] ← rev(seqAlpha)[(n−i+1):n] } return(A) } findMaxAlpha ← function(n) { n ⇐ n s ← rep(0.1,n) names(s) ← paste("N",seq(1,n),sep="") for (alpha in seq(0,1,0.01)) { A ⇐ makeMatrix(alpha) f ← newton(run(state=s,timeplot=FALSE),atol=1e−20) if (min(f)≡0) return(alpha) } return(1) } p ← c(r=1) n ← 3 s ← rep(0.1,n) names(s) ← paste("N",seq(1,n),sep="") A ← makeMatrix(0.5) f ← newton(run(),atol=1e−20) nspecies ← seq(9)+1 maxAlpha ← sapply(nspecies,findMaxAlpha) size ← 5 #inch pdf("niche.pdf",width=size,height=0.75*size) par(mar=c(2.6,2.6,0.2,0.2),mgp=c(1.5,0.5,0)) plot(nspecies,maxAlpha,xlim=c(1,10),ylim=c(0.5,1),xlab="Number of species",ylab="Nich e overlap") lines(nspecies,maxAlpha) axis(1,at=seq(10,from=0)) dev.off()
4 6 8 10 0.5 0.6 0.7 0.8 0.9 1.0 Number of species Niche overlap 1 2 3 4 5 6 7 8 9 10
4 6 8 10 0.5 0.6 0.7 0.8 0.9 1.0 Number of species Niche overlap 1 2 3 4 5 6 7 8 9 10
× J = −1 a −b . . . −1 c . . . −1 . . . −d . . . −1 . . .
maxEigen ← function(n,p,sd) { A ← matrix(0,nrow=n,ncol=n) for (i in seq(n)) for (j in seq(n)) { if (i ≠ j && runif(1) < p) A[i,j] ← rnorm(1,0,sd) } diag(A) ← −1 return(max(sort(Re(eigen(A)$values)))) } n ← 100 p ← 1 s ← 0.25 maxEigen(n,p,s) s*sqrt(n*p) maxP ← 0.25; nPs ← 10; nTrials ← 20 nstable ← rep(0,nPs) for (i in seq(nPs)) { p ← maxP*i/nPs print(c(P=p,Eq10.11=s*sqrt(n*p))) for (j in seq(nTrials)) nstable[i] ← nstable[i] + ifelse(maxEigen(n,p,s)<0,1,0) } plot(maxP*seq(nPs)/nPs,nstable/nTrials,xlab="P",ylab="Fraction stable",main=paste(n,s )) curve(s*sqrt(n*p),from=0,to=maxP,xname="p",add=TRUE)
dNai dt = Nai ⇣ 1 −
n
X
j=1
AijNaj ⌘ +
m
X
b=1
Dab(Nbi − Nai)