( ) 87 87 87 Sr Sr Rb = + t e 1 86 86 - - PowerPoint PPT Presentation

87 87 87 sr sr rb t e 1 86 86 86 sr sr
SMART_READER_LITE
LIVE PREVIEW

( ) 87 87 87 Sr Sr Rb = + t e 1 86 86 - - PowerPoint PPT Presentation

Isotope systematics Generalities Isotopes of the same element exhibit identical chemical behavior. This statement appears to be true for isotopes of heavy elements such as Sr, Nd, Pb, U but not true for isotopes of light elements such as H,


slide-1
SLIDE 1

Isotope systematics

Generalities

  • Isotopes of the same element exhibit identical chemical behavior. This statement appears to

be true for isotopes of heavy elements such as Sr, Nd, Pb, U but not true for isotopes of light elements such as H, C, O, S…. The assumption is made that isotopes such as 87Sr and 86Sr cannot be fractionated from each other by melting, crystallization or metamorphism. The

87Sr/86Sr ratio can only be changed by the passage of time as 87Rb decays or by some mixing

  • process. Note, however, the Rb and Sr do show different chemical behavior.
  • The ratio of the radiogenic isotope to a stable isotope of the same element, e.g., 87Sr/86Sr, in

a rock or mineral at the present day depends on everything that has happened to this particular piece of matter since the solid material of the solar system condensed from the nebula.

  • The equations for radioactive decay are posted on the class website along with the

decay constants and initial (at 4.57 Ga) and present day whole earth values for isotopic systems widely used in petrogenetic modeling (see also next slide). A derivation of the isochron equation (given below) is also provided on the website

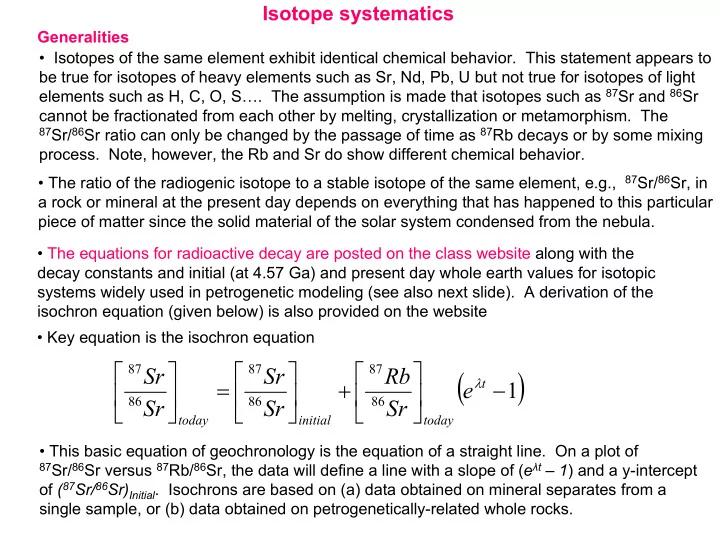
  • Key equation is the isochron equation

( )

1

86 87 86 87 86 87

−       +       =      

t today initial today

e Sr Rb Sr Sr Sr Sr

λ

  • This basic equation of geochronology is the equation of a straight line. On a plot of

87Sr/86Sr versus 87Rb/86Sr, the data will define a line with a slope of (eλt – 1) and a y-intercept

  • f (87Sr/86Sr)Initial. Isochrons are based on (a) data obtained on mineral separates from a

single sample, or (b) data obtained on petrogenetically-related whole rocks.

slide-2
SLIDE 2

Example of internal isochron determined on mineral separates from a Stillwater gabbro Example of a whole rock isochron determined on whole rock samples from the Stillwater Complex

From: DePaolo and Wasserburg (1979) Geochim Cosmochim Acta 43, 999

slide-3
SLIDE 3

Some common isotopic systems with long half lives used as tracers in igneous processes

Radioactive Decay Constant Ratio measured Whole earth values at decay λ - (yr-1) 4.57Ga present

87Rb→87Sr (β)

1.42 x 10⁻¹¹

87Sr/86Sr

0.69898 ~0.7047

147Sm→143Nd (α)

6.54 x 10⁻¹²

143Nd/144Nd

0.506631 0.512638

176Lu→176Hf (β)

1.94 x 10⁻¹¹

176Hf/177Hf

0.27978 0.28290

238U→206Pb (8α)

1.55125 x 10⁻¹⁰

206Pb/204Pb

9.307 ~18.70

235U→207Pb (7α)

9.8485 x 10⁻¹⁰

207Pb/204Pb

10.294 ~15.63

232Th→208Pb (6α)

4.95 x 10⁻¹¹

208Pb/204Pb

29.476 ~38.63

187Re→187Os (β)

1.666 x 10⁻¹¹

187Os/188Os

0.09526 0.12863 Notes: 1. At present day: 238U/235U = 137.88

  • 2. Values for whole earth at 4.57 Ga obtained from meteorites. Values for whole earth at 0 Ga are based
  • n meteorite values for Nd isotopes and εNd vs. εSr correlations.
  • 3. Geochron: 207Pb/204Pb = 0.617976 206Pb/204Pb + 4.524501
  • 4. The isotopic ratio measured in a sample today represent the sum total of all the processes that have

affected this particular piece of matter since the earth accreted

  • 5. Isotopes of the same (heavy) element (those listed above) cannot be fractionated from each other by

natural processes of melting, crystallization or recrystallization. Of course, this is not true for lighter elements such as H, C, O, S

[ ] [ ] [ ] [ ]2

1 1 1 2 86 87 2 1 1 86 87 1 1 86 87

) 1 ( ) 1 ( Sr X Sr X Sr Sr Sr X Sr Sr Sr X Sr Sr

MIX

− +         − +         =      

  • 6. Mixing Equation for Sr for two components

(similar equation for other systems)

  • 7. Hf and Nd isotopes are strongly correlated
slide-4
SLIDE 4

What is the geochron?

λ (yr-1) Ratio measured @ 4.57Ga at present

238U→206Pb

1.55125 x 10⁻¹⁰

206Pb/204Pb

9.307 ~18.70

235U→207Pb

9.84850 x 10⁻¹⁰

207Pb/204Pb

10.294 ~15.63

Values of 206Pb/204Pb and 207Pb/204Pb @ 4.57Ga determined on troilite (FeS) in iron meteorites

( )

1

204 238 204 206 204 206

−       +       =      

t today initial today

e Pb U Pb Pb Pb Pb

λ 238U/204Pb (µ), 235U/204Pb (µ/137.88), t =4.57 Ga

9.307 10.294

18 16 14 12 10 8 10 12 14 8 16 18 20 Geochron

206Pb/204Pb 207Pb/204Pb

µ=10 8 6 4 2

( )

1

204 235 204 207 204 207

−       +       =      

t today initial today

e Pb U Pb Pb Pb Pb

λ

µ 2 11.3705 2/137.88 11.5734 4 13.434 4/137.88 12.8528 6 15.497 6/137.88 14.1322 8 17.561 8/137.88 15.4117 10 19.625 10/137.88 16.6911

206Pb/204Pb

µ/137.88 207Pb/204Pb Geochron represents lead in the earth and meteorites that have evolved in a single-stage from 4.57 to the present day. The geochron defines a line in Pb-Pb space with the equation

207Pb/204Pb = 0.617976 206Pb/204Pb + 4.524501

Why is there no equivalent geochron for 208Pb/204Pb?

slide-5
SLIDE 5

Isotope evolution diagrams (similar diagrams for Lu-Hf and Re-Os systems)

4.57

87Sr/86Sr

0.69898 0.7047 Uniform reservoir evolution line

Time (Ga)

0.512638 0.506631

144Nd/143Nd

Time (Ga)

4.57

Chondrite Uniform Reservoir (CHUR) evolution line

How well do we know the values at 4.567Ga?

0.69898 Average N. American shield (~0.718) Average crust (~0.712) Whole earth (0.7047) Upper mantle (~0.7025) depleted sea water 0.709

4.57

Amitsoq gneiss

During melting: (Rb/Sr)melt > (Rb/Sr)source

(87Sr/86Sr)melt = (87Sr/86Sr)source

Sr enters Ca-rich minerals, especially plagioclase. Rb is essentially excluded from all minerals except micas.

Time (Ga)

slide-6
SLIDE 6

Nd isotopes

It is conventional to use the ε notation when discussing Nd isotopic ratios. In this notation, the ratios are compared to those of the chondritic uniform reservoir (CHUR).

4 143 144 143 144

10 ] 1 [ ) ( x Nd Nd t

CHUR sample −

= ε

e.g., for a zero age MORB, 143Nd/144Nd ratio = 0.513166 and CHUR at zero age = 0.512638

4

10 ] 1 512638 . 513166 . [ x

Nd

− = ε

= + 10.3

As a general rule, during melting and/or crystallization, (Sm/Nd)melt < (Sm/Nd)crystals which means that the residue is depleted in Nd relative to Sm and the melt is enriched in Nd relative to Sm

4.6

εNd 0

time (Ga) CHUR 10 20

  • 10
  • 20

Evolution of depleted mantle Crust derived from mantle at different times

a b c a, b, c: model ages REE in sample/REE in chond

1 A = crust B = mantle La Nd Sm Yb

CHUR

slide-7
SLIDE 7

1 − =

CHUR basalt

Nd Sm Nd Sm f 10

  • 10
  • 20
  • 30
  • 50

50 100 150 Mantle array

εSr εNd

(PUM)

Upper crust Lower crust

fSm/Nd = 0 fRb/Sr = 6 fSm/Nd = -0.4 fRb/Sr = 0 fSm/Nd = -0.4 fRb/Sr = 6

(DMM) DMM: Depleted Morb Mantle PUM: Primitive Upper Mantle

Mantle Correlation curve

0.7047

As a general rule, the lower left quadrant and the upper right quadrant contain few data points. Many, but by no means not all, crustal rocks plot in the lower right quadrant with

  • lder samples plotting further

from whole earth values Mantle array includes samples believed to be derived directly from the mantle with minimal or zero crustal input. Most such samples have +ve εNd and –ve εSr. MORB, OIB, IAB, some CAB, and many continental flood basalts fall in this range. When this correlation was first observed by DePaolo and Wasserburg (1976) they postulated two main isotopic reservoirs in the mantle: DMM (Depleted Morb Mantle at εNd ~10-12) and PUM (Primitive Upper Mantle with εNd around 0). This is now known to be an oversimplification.

slide-8
SLIDE 8

Some details of the mantle array defined by MORB (mid Ocean Ridge Basalts) and OIB (Ocean Island basalts)

0.7047 0.512638

εNd +13

slide-9
SLIDE 9

Isotopic ratios as indicators of mixing processes

Since there is commonly a large difference in the isotopic compositions of crust and mantle, isotopic ratios can provide information on the extent of mixing between these two reservoirs. Mixing is primarily due to assimilation of crustal material by mantle-derived magmas although many different types of mixing can occur. The equation below is the mixing equation for Sr

  • isotopes. Similar equations exist for the other isotopic systems.

[ ] [ ] [ ] [ ]

1 1 2 86 87 2 1 1 86 87 1 1 86 87

) 1 ( ) 1 ( Sr X Sr X Sr Sr Sr X Sr Sr Sr X Sr Sr

MIX

− +         − +         =      

2 1

X1 and X2 are the wt. fractions of components 1 and 2, Sr1 and Sr2 are the abundances of Sr in the two components, (87Sr/86Sr)1 and (87Sr/86Sr)2 are the isotopic ratios of the two components On a plot of εNd vs. εSr, mixing lines are hyperbolas

εNd εSr 1 2

K = 1 K = 0.1 K = 10 0.5 5

After: DePaolo and Wasserburg (1979) Geochimica Cosmochimica Acta 43, 615

K = (Sr/Nd)1/(Sr/Nd)2

If 1 refers to mantle and 2 refers to crust, assimilation will tend to move the mix along a line where K>1

slide-10
SLIDE 10

Mantle reservoirs (defined on basis of isotopes)

The two reservoir model (DMM-PUM) of DPW can’t explain all the Pb isotope data On 87Sr/86Sr vs. 206Pb/204Pb and 143Nd/144Nd vs. 206Pb/204Pb plots, Hart and Zindler (1986) noticed that some data plotted well off a DMM-PUM mixing line so they postulated a 3rd mantle reservoir which they called HIMU, so called because OIBs in this group showed high 206Pb/204Pb values reflecting high 238U/204Pb (µ) values in the mantle

  • source. As the isotopic database increased, more mantle reservoirs were postulated to
  • exist. In addition to the above, we now have EM1 (enriched mantle 1), EM2 (Enriched

Mantle 2), PREMA (PREvalent MAntle) and FOZO (FOcus ZOne mantle) Are Pb isotopes decoupled from Sr and Nd systems? Probably not In the next three figures [all taken from Hart and Zindler (1986)], isotopic data for all oceanic basalts (MORB and OIB) analyzed up to 1986 are plotted. Many more data points now exist but the patterns haven’t changed much.

slide-11
SLIDE 11

87Sr/86Sr versus 206Pb/204Pb plot (from Zindler and Hart (1986)

EM I ? HIMU

This figure shows that mixing of material from the DMM and PUM reservoirs cannot explain the Pb isotopic data. There is a need for an additional reservoirs to explain the St Helena (and other) data (HIMU) and a reservoir to explain data from Samoa, Azores, etc (EM II). A good case can be made for yet another reservoir (EM I).

slide-12
SLIDE 12

143Nd/144Nd versus 206Pb/204Pb plot (from Zindler and Hart (1986)

HIMU EM I EM II DMM A DMM B

Same data as previous slide. The EMI reservoir is required to explain Walvis ridge data and some Hawaiian data (Koolau). What is PREMA?

slide-13
SLIDE 13

208Pb/204Pb and 207Pb/204Pb versus 206Pb/204Pb plot (from Zindler and Hart (1986)

On plots of Pb isotopes of oceanic basalts, MORBs and OIBs from the northern hemisphere plot close to a line with a slope that gives a Pb-Pb age of 1.77Ga. This is called the Northern hemisphere reference line. Note: data that lie above the line are all from the southern hemisphere

slide-14
SLIDE 14

87Sr/86Sr versus 143Nd/144Nd for oceanic basalts

EM I

slide-15
SLIDE 15

Mantle isotopic reservoirs for oceanic basalts

15.0 16.0 17.0 18.0 19.0 20.0 21.0 22.0 15.2 15.4 15.6 15.8

206Pb/204Pb 207Pb/204Pb

DMM B DMM A HIMU EM I EM II PUM PREMA N H R L Pelagic sediments geochron