SLIDE 1 1 Hong Kong Exchange and Clearing Limit ed and The S t ock Exchange of Hong Kong Limit ed t ake no responsibilit y for t he cont ent s of t his announcement , make no represent at ion as t o it s accuracy or complet eness and expressly disclaim any liabilit y what soever for any loss howsoever arising from or in reliance upon t he whole or any part of t he cont ent s of t his announcement . Via A. Fogazzaro n. 28, Milan, It aly Regist ry of Companies of Milan, It aly: No. 10115350158 (Incorporat ed under t he laws of It aly as a j oint -st ock company)
(Stock Code: 1913)
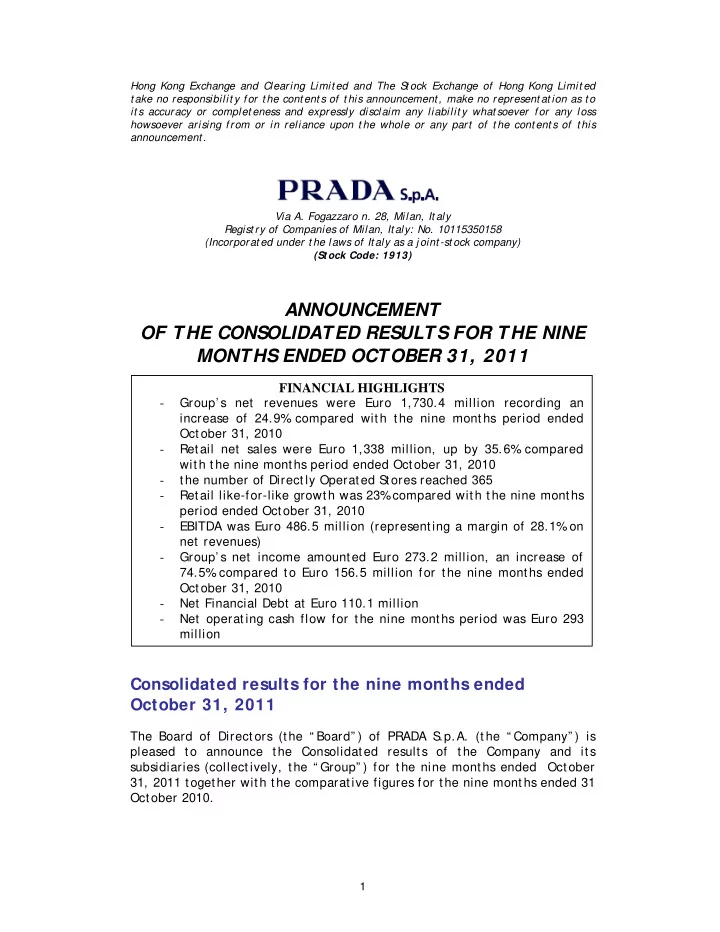
ANNOUNCEMENT OF THE CONSOLIDATED RESULTS FOR THE NINE MONTHS ENDED OCTOBER 31, 2011
Consolidated results for the nine months ended October 31, 2011
The Board of Direct ors (the “ Board” ) of PRADA S .p.A. (t he “ Company” ) is pleased to announce t he Consolidated results of t he Company and it s subsidiaries (collect ively, the “ Group” ) for the nine months ended October 31, 2011 together with the comparative figures for the nine mont hs ended 31 Oct ober 2010.
FINANCIAL HIGHLIGHTS
- Group’ s net revenues were Euro 1,730.4 million recording an
increase of 24.9% compared with t he nine months period ended Oct ober 31, 2010
- Retail net sales were Euro 1,338 million, up by 35.6%
compared with t he nine months period ended October 31, 2010
- the number of Directly Operated S
tores reached 365
- Retail like-for-like growth was 23%
compared with the nine months period ended October 31, 2010
- EBITDA was Euro 486.5 million (representing a margin of 28.1%
- n
net revenues)
- Group’ s net income amounted Euro 273.2 million, an increase of
74.5% compared t o Euro 156.5 million for the nine months ended Oct ober 31, 2010
- Net Financial Debt at Euro 110.1 million
- Net operating cash flow for the nine months period was Euro 293
million
SLIDE 2 2
Key financial information
Key Income statement information (amounts in thousands of Euro) October 31 2010 unaudited January 31, 2011 audited October 31 2011 unaudited % change
October 2010 Net revenues 1,385,513 2,046,651 1,730,379 24.9% Total EBITDA 330,299 535,930 486,507 47.3% Total EBIT 248,811 418,387 392,317 57.7% Income before tax 231,101 388,229 374,458 62.0% Net income of the Group 156,497 250,819 273,165 74.5% Average headcount (persons) 7,094 7,199 7,880 11.1% EBITDA % 23.8% 26.2% 28.1% EBIT % 18.0% 20.4% 22.7% Key Statement of financial position information (amounts in thousands of Euro) October 31 2010 unaudited January 31, 2011 audited October 31 2011 unaudited % change
January 2011 Non-current assets 1,540,470 1,595,990 1,698,856 6.4% Net operating working capital 285,481 320,718 376,357 17.3% Net invested capital 1,563,495 1,585,559 1,754,647 10.7% Net financial debt (third parties) 428,816 408,604 110,070
Group shareholders’ equity 1,132,048 1,204,350 1,639,144 36.1% Investments 139,104 206,860 178,100 Net operating cash flows 232,509 367,712 292,966
Highlights for the nine months ended October 31, 2011
In the nine months period ended October 31, 2011 PRADA Group recorded net revenues of Euro 1,730.4 million, a 24.9% increase over Euro 1,385.5 million posted in t he same period of 2010. The ret ail network was again t he key growth driver. The 39.4% sales increase recorded in the t hird quart er raised t he nine months retail performance to an increase of 35.6% , up by 33.4% recorded in the first six months. EBITDA of t he reported period t ot aled Euro 486.5 million and improved it s incidence on net revenues from 23.8% to 28.1% . The higher profit ability was mainly boosted by channel mix, higher production margins and scale effect s. Increase in operating expenses, as a consequence of the expansion of the business, part ially offset the improvement. Group’ s net income amounted to Euro 273.2 million, an increase of 74.5% compared t o Euro 156.5 million posted in the same period of 2010. On June 24, 2011 the Company’ s shares were successfully listed t hrough an IPO on the Hong Kong S tock Exchange. The new shares issued as part of the IPO process enabled the Group to raise new funds amounting to Euro 206.6 million, net of the costs directly att ributable to t he t ransact ion. Thus, despit e a slight reduct ion due to exchange fluctuations (Euro 7 million) and dividends distribut ed to S hareholders (Euro 35 million), the Group’ s equit y st rengt hened further t o stand at Euro 1,639.1 million at October 31, 2011. The capital inj ection and the free cash flows enabled the Group to further lower its net financial debt (Euro 110.1 million at October 31, 2011) as well
SLIDE 3 3
as t o finance t he capital expenditure program (Euro 187.8 million in t he nine months of 2011).
Consolidated Income Statement for the nine months ended October 31, 2011
(amounts in thousands of Euro) Notes nine months ended October 31, 2011 unaudited % nine months ended October 31, 2010 unaudited % Retail 1,338,022 77.3% 986,704 71.2% Wholesale 368,554 21.3% 376,454 27.2% Royalties 23,803 1.4% 22,355 1.6% Net revenues 3 1,730,379 100% 1,385,513 100% Cost of goods sold (494,730) -28.6% (457,571) -33.0% Gross margin 1,235,649 71.4% 927,942 67.0% Operating expenses 4 (843,332) -48.7% (679,131) -49.0% EBIT 392,317 22.7% 248,811 18.0% Interest and other financial expenses, net 5 (17,859)
(17,710)
Income before taxation 374,458 21.6% 231,101 16.7% Taxation 6 (98,469)
(73,075)
Net income from continuing operations 275,989 15.9% 158,026 11.4% Net income from continuing operations pertaining to Non-Controlling Interests 2,824 0.2% 1,529 0.1% Group net income from continuing operations 273,165 15.8% 156,497 11.3% Total Group net income 273,165 15.8% 156,497 11.3% Amortization, Depreciation and Impairment 94,190 5.4% 81,488 5.9% EBITDA 486,507 28.1% 330,299 23.8% Basic earnings per share (in Euro per share) 7 0.108 0.063 Diluted earnings per share (in Euro per share) 7 0.108 0.063
SLIDE 4 4
Consolidated Income Statement for the three months ended October 31, 2011
(amounts in thousands of Euro) three months ended October 31, 2011 unaudited % three months ended October 31, 2010 unaudited % Retail 502,650 84.3% 360,526 80.3% Wholesale 86,523 14.5% 82,231 18.3% Royalties 6,924 1.2% 6,262 1.4% Net revenues 596,097 100% 449,019 100% Cost of goods sold (165,632) -27.8% (134,897) -30.0% Gross margin 430,465 72.2% 314,122 70.0% Operating expenses (291,527) -48.9% (237,535) -52.9% EBIT 138,938 23.3% 76,587 17.1% Interest and other financial expenses, net (6,258)
1,902 0.4% Income before taxation 132,680 22.3% 78,489 17.5% Taxation (37,892)
(24,386)
Net income from continuing operations 94,788 15.9% 54,103 12.0% Net income from continuing operations pertaining to Non-Controlling Interests 1,155 0.2% 649 0.1% Group net income from continuing operations 93,633 15.7% 53,454 11.9% Total Group net income 93,633 15.7% 53,454 11.9% Amortization, Depreciation and Impairment 32,564 5.5% 28,492 6.3% EBITDA 171,502 28.8% 105,079 23.4%
SLIDE 5 5
Consolidated Statement of Financial Position
(amounts in thousands of Euro) Notes October 31, 2011 unaudited January 31, 2011 audited Assets Current assets Cash and cash equivalents 280,981 96,572 Trade receivables, net 9 233,331 274,175 Inventories 8 385,038 280,409 Derivative financial instruments - current 4,867 7,379 Receivables from parent company and related parties 10 5,880 36,317 Other current assets 12 102,363 70,225 Assets held for sale
Total current assets 1,012,460 770,025 Non-current assets Property, plant and equipment 11 622,224 536,717 Intangible assets 11 865,209 869,119 Associated undertakings 1,753 1,753 Deferred tax assets 18 158,367 141,378 Other non-current assets 13 50,344 44,883 Derivative financial instruments - non current 959 2,140 Total non-current assets 1,698,856 1,595,990 Total Assets 2,711,316 2,366,015 Liabilities and Shareholders’ equity Current liabilities Bank overdrafts and short-term loans 168,428 194,240 Payables to parent company and related parties 14 367 1,107 Other shareholders’ loans 573 581 Trade payables 15 242,012 233,866 Current tax liabilities 111,139 107,592 Derivative financial instruments - current 3,062 5,279 Obligations under finance leases - current 2,391 5,019 Other current liabilities 16 110,523 111,482 Total current liabilities 638,495 659,166 Non-current liabilities Long-term debt 218,955 303,408 Obligations under finance leases - non current 1,277 2,509 Long term employee benefits 35,741 34,833 Provisions for risks and charges 17 55,790 52,725 Deferred tax liabilities 18 48,674 52,711 Other non-current liabilities 66,885 50,207 Derivative financial instruments - non current 85 318 Total non-current liabilities 427,407 496,711 Total Liabilities 1,065,902 1,155,877 Shareholders’ equity Share capital 255,882 250,000 Other reserves 1,157,067 743,543 Translation reserve (46,970) (40,012) Net profit for the period 273,165 250,819 Total Shareholders’ Equity – Group 1,639,144 1,204,350 Shareholders’ Equity – Non Controlling Interests 6,270 5,788 Total Liabilities and Shareholders’ Equity 2,711,316 2,366,015 Net current assets 373,965 110,859 Total assets less current liabilities 2,072,821 1,706,849
SLIDE 6 6
Statement of changes in the Group’s Equity (amounts in thousands of Euro, except for number of shares)
(amounts in thousands
Number of shares Share Capital Share premium reserve Transla- tion reserve Other reserves Cash Flow Hedge Actu- arial Reserve Net profit Group’s Equity Balance at January 31, 2010 250,000,000 250,000 209,298 (45,671) 541,436 (2,893) (4,430) 100,163 1,047,903 Allocation of 2009 Net profit
- 100,163
- (100,163)
- Other movements
- (4)
- (4)
Dividends
Transactions with Non-Controlling Interests
Comprehensive Net income for the period
3,482 250,819 266,317 Balance at January 31, 2011 250,000,000 250,000 209,298 (40,012) 531,729 3,464 (948) 250,819 1,204,350 Allocation of 2010 Net profit
- 250,819
- (250,819)
- Conversion of the
shares par value from Eur 1.0 to Eur 0.1 2,500,000,000
shares 58,824,000 5,882 200,749
Dividends
Capital injection in subsidiaries
Net income for the period
(2,614) (430) 273,165 263,163 Balance at October 31, 2011 2,558,824,000 255,882 410,047 (46,970) 747,548 850 (1,378) 273,165 1,639,144
Under Italian law, t he Company has to allocat e a portion of its annual net profits to a non-distributable reserve and provide further information on the distribution of profit s.
SLIDE 7 7
Statement of Consolidated Comprehensive Income
(amounts in thousands of Euro) nine months ended October 31, 2011 unaudited nine months ended October 31, 2010 unaudited Consolidated Net income for the period 275,989 158,026 Cumulative Translation adjustment (6,794) 3,828 Tax impact
- Cumulative Translation adjustment, net of tax impact
(6,794) 3,828 Change in Cash Flow Hedge Reserve (3,505) 5,924 Tax impact 891 (2,169) Change in Cash Flow Hedge Reserve, net of tax impact (2,614) 3,755 Change in Actuarial Reserve (613) (1,301) Tax impact 173 252 Change in Actuarial Reserve, net of tax impact (440) (1,049) Comprehensive Consolidated Net income for the period 266,141 164,560 Comprehensive Non-Controlling Interests Net income for the period 2,978 1,547 Comprehensive Group Net income for the period 263,163 163,013
Net Invested Capital
The following table cont ains the S t at ement of Financial Position adj usted in
- rder to provide a better picture of t he Net Invested Capital.
(amounts in thousands of Euro) October 31, 2011 unaudited January 31, 2011 audited Non current assets 1,698,856 1,595,990 Current assets excluding financial assets 730,069 634,462 Current liabilities excluding financial liabilities 467,103 459,047 Net working capital 262,966 175,415 Assets held for sale
Long-term liabilities, including deferred taxation 115,644 103,236 Post employment benefits 35,741 34,833 Provisions for risks 55,790 52,725 Net invested capital 1,754,647 1,585,559 Shareholders’ equity – Group 1,639,144 1,204,350 Shareholders’ equity – Non Controlling Interests 6,270 5,788 Total consolidated shareholders’ equity 1,645,414 1,210,138 Long term financial payables 220,232 305,917 Short term financial payables, net of cash and cash equivalents (110,999) 69,504 Net financial payables 109,233 375,421 Shareholders’ equity and net financial payables 1,754,647 1,585,559
SLIDE 8 8
Net Financial Debt
(amounts in thousands of Euro) October 31, 2011 unaudited January 31, 2011 audited Long term debt 218,955 303,408 Obligations under finance leases 1,277 2,509 Long term financial payables 220,232 305,917 Short term financial payables and bank overdrafts 168,428 194,240 Payables to parent company and related parties
Receivables from parent company and related parties (1,410) (34,044) Obligations under finance leases 2,391 5,019 Payables to other shareholders 573 581 Cash and cash equivalents (280,981) (96,572) Short term financial payables, net of cash and cash equivalents (110,999) 69,504 Net Financial Debt 109,233 375,421 Net Financial Debt, excluding receivables/payables with parent company, related parties and other shareholders (NFP used to calculate covenants) 110,070 408,604 NFP/EBITDA ratio 0.16 0.76 EBITDA/ net financial charges ratio 27.24 17.77
Summarized Statement of Consolidated Cash Flows
(amounts in thousands of Euro) nine months ended October 31, 2011 unaudited nine months ended October 31, 2010 unaudited Net cash flows from operating activities 292,966 232,509 Cash flows generated/(utilized) by investing activities (187,836) (138,097) Cash flows generated/(utilized) by financing activities 96,266 (44,791) Change in cash and cash equivalents, net of bank overdrafts 201,396 49,983
SLIDE 9 9
Notes to the consolidated results for the nine months ended October 31, 2011
1. Presentation of PRADA Group
PRADA Group is a world leader in t he design, production and distribution of luxury handbags, leather goods, footwear, apparel, accessories, eyewear and
- fragrances. Through its directly-operated–
st ores network (DOS ) and a select number of wholesalers, the Group operat es on all maj or internat ional markets. The Company is a j oint-stock company, incorporated and domiciled in It aly. Its registered office is in via Fogazzaro 28, Milan, Italy.
2. Basis of preparation
The Notes to the consolidated results for t he nine months ended October 31, 2011 refer to the Group of companies controlled by PRADA spa (the "Company"), holding company of the PRADA Group (t he "Group") and it is based on the consolidated result s of t he Group at October 31, 2011. The following financial information, including comparative figures, was prepared
- n a consistent basis with respect to the Consolidated Financial S
tat ement s
- f the PRADA Group at July 31, 2011 which, in turns, were prepared in
accordance wit h the International Financial Reporting S t andards (“ IFRS ” ) issued by the International Account ing S tandard Board (“ IAS B” ) as adopted by t he European Union. The IFRS adopt ed by the European Union are similar, as applicable to the PRADA Group, to t hose issued by the IAS B. IFRS also refer to all the International Accounting S t andards (“ IAS ” ) and all t he int erpretations of the International Financial Reporting Interpretation Committee (“ IFRIC” ), previously named t he S tanding Interpret at ions Committee (“ S IC” ). The Group has prepared the Consolidated S tat ement of Financial Position classifying separat ely current and non-current assets and liabilit ies. The Consolidated Income S t atement is present ed by destinat ion. The Consolidated Financial S tatements have been prepared on a going concern basis and are present ed in Euro, which is the functional currency of t he Company.
SLIDE 10
10
3. Net revenues analysis Three months ended October 31, 2011
(amounts in thousands of Euro) three months ended October 31, 2011 unaudited three months ended October 31, 2010 unaudited % change Net sales by geographical area Italy 104,776 17.8% 82,294 18.6% 27.3% Europe 121,925 20.7% 91,753 20.7% 32.9% North America 85,790 14.6% 69,334 15.7% 23.7% Asia Pacific 211,743 35.9% 146,155 33.0% 44.9% Japan 61,728 10.5% 51,550 11.6% 19.7% Other countries 3,211 0.5% 1,671 0.4% 92.2% Total 589,173 100.0% 442,757 100.0% 33.1% Net sales by brand Prada 467,715 79.4% 343,983 77.7% 36.0% Miu Miu 98,474 16.7% 77,922 17.6% 26.4% Church's 16,599 2.8% 15,348 3.5% 8.2% Car shoe 4,296 0.7% 3,908 0.9% 9.9% Other 2,090 0.4% 1,596 0.4% 31.0% Total 589,173 100.0% 442,757 100.0% 33.1% Net sales by product line Clothing 125,350 21.3% 113,451 25.6% 10.5% Leather goods 341,319 57.9% 224,433 50.7% 52.1% Footwear 116,327 19.7% 100,759 22.8% 15.5% Other 6,177 1.1% 4,114 0.9% 50.1% Total 589,173 100.0% 442,757 100.0% 33.1% Net sales by distribution channel DOS (including outlet stores) 502,650 85.3% 360,526 81.4% 39.4% Independent customers, franchises and related parties 86,523 14.7% 82,231 18.6% 5.2% Total 589,173 100.0% 442,757 100.0% 33.1% Net sales 589,173 98.8% 442,757 98.6% 33.1% Royalties 6,924 1.2% 6,262 1.4% 10.6% Total net revenues 596,097 100.0% 449,019 100.0% 32.8%
SLIDE 11 11
Nine months ended October, 31 2011
(amounts in thousands of Euro) nine months ended October 31 2011 unaudited nine months ended October 31 2010 unaudited % change Net sales by geographical area Italy 318,221 18.6% 266,595 19.6% 19.4% Europe 372,589 21.8% 303,548 22.3% 22.7% North America 257,643 15.1% 216,951 15.9% 18.8% Asia Pacific 579,737 34.0% 417,858 30.7% 38.7% Japan 168,921 9.9% 150,657 11.1% 12.1% Other countries 9,465 0.6% 7,549 0.5% 25.4% Total 1,706,576 100.0% 1,363,158 100.0% 25.2% Net sales by brand Prada 1,346,098 78.9% 1,068,317 78.4% 26.0% Miu Miu 297,345 17.4% 237,142 17.4% 25.4% Church's 43,602 2.6% 38,788 2.8% 12.4% Car shoe 14,007 0.8% 13,719 1.0% 2.1% Other 5,524 0.3% 5,192 0.4% 6.4% Total 1,706,576 100.0% 1,363,158 100.0% 25.2% Net sales by product line Clothing 337,721 19.8% 327,457 24.0% 3.1% Leather goods 957,907 56.1% 680,074 49.9% 40.9% Footwear 391,376 22.9% 343,414 25.2% 14.0% Other 19,572 1.2% 12,213 0.9% 60.3% Total 1,706,576 100.0% 1,363,158 100.0% 25.2% Net sales by distribution channel DOS (including outlet stores) 1,338,022 78.4% 986,704 72.4% 35.6% Independent customers, franchises and related parties 368,554 21.6% 376,454 27.6%
Total 1,706,576 100.0% 1,363,158 100.0% 25.2% Net sales 1,706,576 98.6% 1,363,158 98.4% 25.2% Royalties 23,803 1.4% 22,355 1.6% 6.5% Total net revenues 1,730,379 100.0% 1,385,513 100.0% 24.9%
SLIDE 12 12
Number of stores
October 31 2011 January 31 2011 October 31 2010 DOS franchises DOS franchises DOS franchises Prada 230 19 207 27 200 29 Miu Miu 89 5 71 6 69 7 Church’s 41
5
365 24 319 33 310 36 October 31 2011 January 31 2011 October 31 2010 DOS franchises DOS franchises DOS franchises Italy 42 5 37 5 38 5 Europe 107 6 88 13 83 13 North America 40
110 13 99 13 97 16 Japan 64
2
Total 365 24 319 33 310 36
SLIDE 13
13
A list of stores opened and closed during the period is provided below.
Prada Opened 27 DOS opened from February 1 to October 31, 2011 Leccio (Italy) Marcianise (Italy) Forte dei Marmi Men (Italy) Corte Ingles, Madrid (Spain) Berlin (Germany) Parndorf (Austria) Avenue Montaigne Men, Paris (France) Le Bon Marché Bags & Accessories, Paris (France) Tsum Bags & Accessories, Moscow (Russia) Tsum Women Ready-to-Wear, Moscow (Russia) Tsum Men Ready-to-Wear, Moscow (Russia) Barvika, Moscow (Russia) Umeda Diamaru, Osaka (Japan) Ikebukuru Seibu Bags & Accessories, Tokyo (Japan) Matsuzakaya, Nagoya (Japan) Sanda (Japan) Yurakucho Hankyu Men Leather Goods, Tokyo (Japan) Yurakucho Hankyu Men Ready-to-Wear & Shoes, Tokyo Shinsagae Centum, Incheon (South Korea) Hyundai, Ulsan (South Korea) Galleria, Daejeon (South Korea) Wuqing (China) Fortune, Wenzhou (China) Charter, Harbin (China) Taikoo Hui, Guangzhou (China) Westfield, Sydney (Australia) Burjuman Saks Fifth Avenue, Dubai (U.A.E.) Miu Miu Opened 19 DOS opened from February 1 to October 31, 2011 Capri (Italy) Corte Ingles, Madrid (Spain) Barcelona (Spain) Harrods Ready-to-Wear, London (United Kingdom) Harrods Bags & Accessories, London (United Kingdom) Stoleshnikov, Moscow (Russia) Tsum Bags & Accessories, Moscow (Russia) Short Hills (United States) Umeda Diamaru, Osaka (Japan) Nagoya (Japan) Okinawa (Japan) Takashimaya, Nagoya (Japan) Ikebukuro Seibu, Tokyo (Japan) Apku Hyundai Main, Seoul (South Korea) Gyeonggi Shinsagae, Youngin (South Korea) Sogo (Hong Kong) Taikoo Hui, Guangzhou (China) Westfield, Sydney (Australia) Burjuman Saks Fifth Avenue, Dubai (U.A.E.) Church’s Opened 5 DOS opened from February 1 to October 31, 2011 Marcianise (Italy) Printemps, Paris (France) Printemps Parly, Paris (France) Roermond (The Netherlands) New Bond St. Women, London (United Kingdom) Prada Closed 4 DOS closed from February 1 to October 31, 2011 Renhe, Chengdu (China) Martin Place, Sydney (Australia) Ikebukuro Tobu, Tokyo (Japan) Mitsukoshi, Nagoya (Japan) Miu Miu Closed 1 DOS closed from February 1 to October 31, 2011 Mitsukoshi, Nagoya (Japan)
SLIDE 14 14
4. Operating Expenses
(amounts in thousands of Euro) nine months ended October 31, 2011 unaudited % of net revenues nine months ended October 31, 2010 unaudited % of net revenues Product design and development costs 72,946 4.2% 70,693 5.1% Advertising and communications costs 90,544 5.2% 61,886 4.5% Selling costs 556,592 32.2% 447,772 32.3% General and administrative costs 123,250 7.1% 98,780 7.1% Total 843,332 48.7% 679,131 49.0%
5. Interest and other financial expenses, net
(amounts in thousands of Euro) nine months ended October 31, 2011 unaudited nine months ended October 31, 2010 unaudited Interests expenses on borrowings (13,078) (12,232) Interest income 1,394 1,089 Exchange gains / (losses) - realized (2,628) (6,352) Exchange gains/ (losses) – unrealized (603) 1,697 Other financial income / (expenses) (2,944) (2,570) Revaluations and write-down of investments
Total (17,859) (17,710)
6. Taxation
(amounts in thousands of Euro) nine months ended October 31, 2011 unaudited nine months ended October 31, 2010 unaudited Current taxation 117,305 82,470 Deferred taxation (18,836) (9,395) Total 98,469 73,075
SLIDE 15 15
7. Earnings and dividends per share
Basic earnings per share are calculat ed by dividing t he net profit attribut able t o equity owners of PRADA spa by the weight ed average number of ordinary shares in issue during the period.
nine months ended October 31, 2011 unaudited nine months ended October 31, 2010 unaudited Group’s net result in Euro 273,164,791 156,496,791 Weighted average number of ordinary outstanding shares 2,528,011,429 2,500,000,000 Basic earnings per share (in Euro per share) 0.108 0.063 Diluted earnings per share (in Euro per share) 0.108 0.063
On May 26, 2011, the S hareholders of PRADA spa resolved t o change t he par value of t he Company shares from Euro 1 to Euro 0.1 each. In accordance with IAS 33, the new number of shares - some 2,500,000,000 - has been adj usted retrospectively for the purposes of t he calculation of earnings per share. During the nine months ended October 31, 2011 the Company dist ributed dividends for Euro 35 million, or Euro 0.14 per share, as approved by the S hareholders’ meeting held on March 28, 2011 in respect of the Financial S tatements ended January 31, 2011. These dividends were offset against receivables due from cont rolling S hareholder PRADA Holding bv for an amount of Euro 32.5 million with the remaining amount being paid. During the year ended January 31, 2011 the S hareholders’ meeting held on April 28, 2010 approved a distribution of Euro 0.32 per share, representing a t otal dividend of Euro 80 million. This dividend was paid on July 27, 2010 for an amount of Euro 27.9 million and, on the same date, an amount of Euro 52.1 million was offset against the receivable due from our cont rolling S
- hareholder. Furt hermore, t he S
hareholders’ meeting held on January 27, 2011 approved a distribution of Euro 0.124 per share, representing a t ot al dividend of Euro 31 million which was paid in full on the same date.
8. Inventories
(amounts in thousands of Euro) October 31, 2011 unaudited January 31, 2011 audited Raw materials 79,336 63,672 Work in progress 23,330 17,186 Finished products 348,790 263,341 Allowance for obsolete and slow moving inventories (66,418) (63,790) Total 385,038 280,409
The increase in invent ories of finished product s was consistent wit h t he higher volume of production necessary to supply t he expanded DOS network.
SLIDE 16 16
9. Trade receivables, net
Trade receivables are det ailed as follows:
(amounts in thousands of Euro) October 31, 2011 unaudited January 31, 2011 audited Trade receivables – third parties 224,728 266,376 Trade receivables – associated companies
Trade receivables – related parties 18,781 16,412 Allowance for bad and doubtful debts (10,178) (10,537) Total 233,331 274,175
Net trade receivables decreased at October 31, 2011 mainly because of the collection of the wholesale deliveries and a low seasonality of the wholesale business in the t hird quart er of the year.
- 10. Receivables from parent companies and related parties
Receivables from parent companies and related companies are detailed below:
(amounts in thousands of Euro) October 31, 2011 unaudited January 31, 2011 audited Financial receivables – PRADA Holding bv
Financial receivables – other companies controlled by PRADA Holding bv
Financial receivables – other related parties 1,410 1,409 Other receivables – PRADA Holding bv 653 767 Other receivables – other related parties 3,790 1,329 Other receivables – other companies controlled by PRADA Holding bv 27 172 Other receivables – associated companies
Total 5,880 36,317
SLIDE 17 17
Changes in the net book value of “ Property, plant and equipment” in the period ended October 31, 2011 are as follows:
(amounts in thousands
Land and building s Producti
and ma- chinery Lease- hold improve- ments Furni- ture & fittings Other equip- ment Assets in progress Total net book value Balance at January 31, 2011 audited 145,602 15,042 220,112 72,109 24,695 59,157 536,717 Additions 39,037 4,670 45,393 8,702 14,597 46,944 159,343 Depreciation (3,720) (4,903) (44,945) (13,528) (4,220)
Disposals
(5) (135) (59) (15) (217) Exchange differences (801) (11) (701) (207) (10) 1,149 (581) Other movements 284
4,235 2,657 (21,098) 432 Impairment and write off
(258) (1) (1,187) (2,154) Balance at October 31, 2011 unaudited 180,402 14,795 233,500 70,918 37,659 84,950 622,224
Changes in the net book value of “ Intangible asset s” in the period ended Oct ober 31, 2011 are as follows:
(amounts in thousands of Euro) Trade- marks Good- will Store Lease Acquis. Soft- ware Develop- ment costs Assets in progress Total net book value Balance at January 31, 2011 audited 312,460 503,946 36,087 6,385 7,869 2,372 869,119 Additions 129
1,647 1,257 1,896 18,757 Amortization (8,247)
(2,177) (4,062)
Disposals
(1)
Exchange differences (807) (123) (69)
2 (999) Other movements
873
(944) Impairment and write off
(15) Balance at October 31, 2011 unaudited 303,535 503,823 43,842 6,726 5,061 2,222 865,209
Ot her current assets are detailed as follows:
(amounts in thousands of Euro) October 31, 2011 unaudited January 31, 2011 audited VAT 28,999 19,249 Income tax and other tax receivables 9,427 9,794 Other current assets 20,260 7,783 Prepayments and accrued income 41,948 31,842 Deposits 1,729 1,557 Total 102,363 70,225
SLIDE 18 18
- 13. Other non-current assets
Ot her non-current assets are detailed as follows:
(amounts in thousands of Euro) October 31, 2011 unaudited January 31, 2011 audited Guarantee deposits 43,229 37,945 Deferred rental income 2,074 1,981 Other receivables 5,041 4,957 Total 50,344 44,883
- 14. Payables to parent companies and related parties
Payables to parent companies and relat ed parties are detailed as follows:
(amounts in thousands of Euro) October 31, 2011 unaudited January 31, 2011 audited Financial payables – PRADA Holding bv
Financial payables – other companies controlled by PRADA Holding bv
Other payables – PRADA Holding bv 23 30 Other payables – other related parties 340 786 Other payables – other companies controlled by PRADA Holding bv 4 10 Total 367 1,107
Trade payables are det ailed as follows:
(amounts in thousands of Euro) October 31, 2011 unaudited January 31, 2011 audited Trade payables – third parties 236,049 232,143 Trade payables – related parties 5,963 1,701 Trade payables – associated companies
Total 242,012 233,866
- 16. Other current liabilities
Ot her current liabilities are detailed as follows:
(amounts in thousands of Euro) October 31, 2011 unaudited January 31, 2011 audited Payables for capital expenditure 21,544 41,134 Accrued expenses and deferred income 23,247 23,423 Other payables 65,732 46,925 Total 110,523 111,482
SLIDE 19 19
- 17. Provisions for risks and charges
Movements on provisions for risks and charges are summarized as follows:
(amounts in thousands of Euro) Provision for litigation Provision for tax disputes Other provisions Total Opening balance 846 40,091 11,788 52,725 Exchange differences
(149) 232 Reversals (47) (1,233) (55) (1,335) Utilized
(892) (1,084) Increases 263 3,081 1,908 5,252 Closing balance 1,062 42,128 12,600 55,790
Provisions for risks and charges represent the Directors’ best estimate of maximum contingent liabilit ies. In t he Directors’ opinion, and based on the information available to them, the total amount provided for risks and charges was reasonable considering the contingent liabilities that might arise.
- 18. Deferred tax assets and liabilities
Deferred tax asset s and liabilities are detailed by nature as follows:
(amounts in thousands of Euro) October 31, 2011 unaudited January 31, 2011 audited Deferred tax assets Deferred tax liabilities Deferred tax assets Deferred tax liabilities Inventories 72,578
- 62,284
- Receivables and other assets
573 1,500 415 1,515 Depreciation/Useful life of non current assets 50,748 13,834 53,869 6,273 Deferred taxes due to acquisitions
Provision for risks / accrued expenses 16,069 267 10,790 267 Non deductible / taxable charges / income 10,122 658 5,893 1,134 Tax loss carry-forwards 3,143
- 3,129
- Derivative financial instruments
- 354
303 1,455 Long term employee benefits 4,593 1,851 4,533 1,943 Other 541 957 162 576 Total 158,367 48,674 141,378 52,711
SLIDE 20 20
Management Discussion and Analysis for the three months ended October 31, 2011
Net revenues
Consolidated net revenues for the third quarter ended Oct ober 31, 2011 amounted t o Euro 596.1 million, a 32.8% increase over the same quarter of
- 2010. On an overall basis, t his third quarter further strengthened the already
excellent growth recorded up t o July 2011. The ret ail network showed an out standing performance wit h a 39.4% growt h, showing an even bett er trend compared t o first and second quarter of 2011.The wholesale channel, notwit hst anding lower deliveries typical of this t ime of the year, showing an increase of 5.2% in respect of the 4.1% decline
From a geographical point of view, all market s recorded double digit pace of
- growth. It is worth ment ioning the remarkable 44.9%
increase in the Asia Pacific and the encouraging 19.7% in Japan. Leather goods, recording a brilliant performance wit h an increase of 52.1% compared to the third quart er of 2010, remained as the leading segment contributing 57.9%
Operating results
The EBITDA of the t hree mont hs ended October 31, 2011 amounted t o Euro 171.5 million, up by 63.2% compared to the same quart er of 2010. It s incidence on net revenues increased from 23.4% t o 28.8% . The growth, both marginal and absolute, was achieved mainly as a result of the higher contribution of the retail channel (from 81.4% to 85.3% ), the improvements achieved in unit margins and scale effects. The Group’ s net result amount ed to Euro 94.8 million, an increase of 75.2% compared to Euro 54.1 million gained in the third quart er of 2010. The relevant incidence on net revenues increased from 11.9% to 15.7% thanks to higher operating profitability and a lower tax rate.
SLIDE 21 21
Management Discussion and Analysis for the nine months ended October 31, 2011
Net revenues
Consolidated net revenues for t he nine mont hs ended October 31, 2011 amounted to Euro 1,730.4 million, recording an excellent 24.9% increase compared to the same period of 2010. At const ant exchange rates, t he increase would have been equal t o 27.5% .
Distribution channels
Retail net sales t ot aled Euro 1,338 million, up by 35.6% (38.6% at constant exchange rates) compared to Euro 986.7 million posted in the nine months ended October 31, 2010. The remarkable growth delivered by the channel came as a result of the like-for-like growth, which was equal to 23% , t he full contribution of t he 54 shops opened in 2010 full year and t he contribut ion of a net of new 46 shops opened in the last nine months (51 opened and 5 closed). In the nine months period ended October 31, 2011 the retail expansion strategy has been realized through t he extension of the Group’ s presence in countries with a high growth rat e in the luxury industry as well as in areas where the Group’ s brands are st ill under represent ed. For the nine mont hs ended October 31, 2011, the 365 stores operated by the Group contribut ed 78.4%
in the same period of 2010). The wholesale business, consist ently with t he Group’ s distribution strategy, remained stable compared wit h the same period of last year (-0.3% at constant exchange rates) and, reaching Euro 368.6 million, accounted for 21.6%
Markets
The exceptional momentum of t he Asia Pacific markets consolidated further in t he third quart er raising the increase over the nine months ended October 31, 2010 to 38.7% (43.5% at constant exchange rat es). The like-for-like performance drove the growt h with 34% increase while the cont ribution of t he DOS network expansion made t he rest (a net of 11 new locations were inaugurated in 2011 up to October). Out of these excellent trends it is worth mentioning the Greater China market , whose pace of growth reached 40%
a like-for-like basis, 42.2%
- n reported rates and 50.4%
at constant exchange rat es. In Europe, net sales increased by 22.7% (23.5% at constant exchange rates) to st and at Euro 372.6 million in 2011 from Euro 303.5 million in the nine months ended October 31, 2010. The sales improvement , driven by the retail channel with its 17% like-for-like growth and the contribution of t he DOS
- pened (19 in 2011 and 15 in 2010 full year), was part ially offset by a drop in
t he wholesale channel (down by 7.6% compared to the nine months ended Oct ober 31, 2010). It has to be noted t hat, as part of a maj or DOS expansion
SLIDE 22 22
in Russia, a number of 5 independent stores (4 Prada, 1 Miu Miu) were inaugurated in Moscow in t he last months of the period under examination. The It alian market posted net sales of Euro 318.2 million for t he nine months ended October 31, 2011, posting a 19.4% increase over the same period of
- 2010. The overall growt h was driven by t he ret ail channel thanks to t he
contribution of t he 29% like-for-like growth and t o t he new DOS
2011 and 6 in 2010 full year). The net sales t rend of this market was partially
- ffset by a slight decline of t he wholesale business (decrease of 5.9%
compared t o the nine months period ended October 31, 2010). The North American market recorded an 18.8% increase compared to t he nine months ended Oct ober 31, 2010 (27.1% at constant exchange rates). The growth was achieved t hanks to the performances of both t he retail and the wholesale channels. DOS sales, driven by a like-for-like growth of 15% and DOS
- pened (1 in 2011 and 13 in 2010 full year), increased by 22.6%
. Thanks t o deliveries to t he US department stores and to the general recovery of t he consumer market , the wholesale channel performed well wit h a 12.1% increase compared t o October 31, 2010. After being hit by t he dramatic events in March 2011, the Japanese market remained solid for the Group’ s brands as net sales increased by 12.1% (9.4% at const ant exchange rates). There have been 8 net new st ores opened in 2011, 3 in 2010 full year and like-for-like growth was flat. After a rationalization of t he dist ribution network in the Middle East
- perated in the 2010, and the opening on August 29, 2011 of t he first Prada
and Miu Miu independent DOS in the depart ment st ore S aks Fifth Avenue in Dubai, t he net sales of t his area increased by 25.4% to stand at Euro 9.5 million up to Oct ober 31, 2011.
Products
The out-performance of leather goods, which grew by 40.9% (43.9% at constant exchange rates) in the nine months ended Oct ober 31, 2011, was mainly driven by the change in the geographical and channel mix. Wit h t he best pace of growth in terms of net sales by product s, the leather goods raised t heir cont ribution to Group’ s net sales from 49.9% at October 31, 2010 t o 56.1% at Oct ober 31, 2011. Ready-t o-Wear, thanks t o the contribution of t he third quart er, turned into a positive trend of growth with a 3.1% increase
- ver t he nine mont hs ended October 31, 2010.
Brands
The Prada brand account s for 78.9%
- f Group’ s net sales (78.4%
in the same period of 2010) and it s sales performance was broadly in line with the comments made above which apply to t he ent ire Group. The Miu Miu brand, with the highest incidence of the ret ail and leather goods sales, delivered the best pace of growt h in terms of net sales in Europe (27.7% at reported rates, 28.9% at constant exchange rates) and in America (25.2% at reported rates, 34.3% at constant exchange rates).
SLIDE 23 23
The Church’ s brand confirmed its double-digit rate of growt h with a 12.4% increase compared to the nine months ended Oct ober 31, 2010 (13.8% at constant exchange rates). Car S hoe net sales showed a slight recovery result ing in an overall 2.1% increase.
Royalties
The licensed products business contributed net revenues of Euro 23.8 million (Euro 22.4 million in t he nine months ended Oct ober 31, 2010), including royalties of Euro 18.3 million on sales of eyewear (Euro 18.4 million in t he same period of 2010), Euro 3.6 million on sales of perfume (Euro 2.7 million in the same period of 2010) and Euro 0.8 million from a new license with Hyundai, the Korean automaker, for t he launch of a special limited edition luxury version of their Genesis car. Overall, royalties income increase by 6.5% compared to the same period of 2010.
Operating results
Operat ing profit ability recorded by the Group surged 47.3% compared to t he same period of 2010. EBITDA of the period ended October 31, 2011 amounted t o Euro 486.5 million, rising from 23.8%
. The improvement has been achieved mainly as a result of t he action t aken to improve gross margin as a percent age of net revenues and it rose from 67% in t he nine months ended Oct ober 31, 2010 to 71.4% . The higher incidence of retail channel sales, the increase in unit margins and a more favorable rat io
- f full price sales to sales at promotional prices led to the strong
improvement not withstanding t he negative impact of currencies. Operat ing expenses increased in absolute t erms from Euro 679.1 million in t he period ended October 31, 2010 to Euro 843.3 million in the period ended Oct ober 31, 2011 slightly reducing their incidence on net revenues from 49% t o 48.7% . At constant exchange rates, operating expenses would have increased by 26% rather than by 24.2% . The expansion of the retail net work and the business in general contributed to the higher level of selling, general and administrative expenses, while the increased spending for media boosted t he advert ising and communicat ion costs, mainly in the third quarter and in line with the strategy announced for t his year. Product design and development cost s, being mainly fixed, reduced their incidence on net revenues from 5.1% to 4.2% . The EBIT, despite the huge investments in tangible assets incurred in previous years and current period, improved even more than t he EBITDA raising it s profitabilit y in terms of incidence on net revenues from 18% to 22.7% (EBITDA from 23.8% t o 28.1% ). The increase over the nine months ended October 31, 2010 was 57.7% . Interest expenses on borrowings slight ly increased compared to 2010 up to Oct ober. The benefit of lower average bank borrowing was approximat ely
- ffset by the rising in the cost of funding as the bank debt profile became
more long term. The funds raised wit h the IPO allowed t he Group to account
SLIDE 24 24
for more interest income as a result of temporary low risk short-term bank deposits. Despite the higher level of income generated, the tax charge decreased from 31.6% in the period ended October 31, 2010 to 26.3% , essentially because of t he change in the geographical mix of t axable income, as a result of the change in the geographical mix of sales with slight ly more favorable tax rat es, and provisions made in 2010 for ongoing tax disputes. The Group’ s net income was Euro 273.2 million, or 15.8%
74.5% increase compared to net income of Euro 156.5 million report ed at Oct ober 31, 2010.
Net Invested Capital
Net invested capital at Oct ober 31, 2011 increased as a consequence of t he invest ments and a higher level of the net operat ing working capit al. Group S hareholder’ s equity strengthened furt her compared to January 31, 2011 mainly because of t he capital inj ection resulting from t he IPO (Euro 206.6 million) and the net income for the nine months period (Euro 273.2 million), as partially offset by dividends dist ributed (Euro 35 million) and t he negat ive impact of exchange rate fluct uation on net assets not denominated in Euro (Euro 7 million).
Analysis of net operating working capital
The increase in t he net operating working capital compared to January 31, 2011 was mainly affected by the higher level of st ock in line with the expansion of the retail net work and sales.
Net Financial Debt
At October 31, 2011, t he Group’ s Net Financial Debt amount ed to Euro 110.1 million, with a Euro 298.5 million reduct ion compared to January 31, 2011. As shown in the S ummarized S tat ement of Consolidated Cash Flows, t he capital inj ection result ing from the IPO (Euro 205.2 million included in t he line “ Cash flows generat ed by financing act ivities” ) and net cash flows from
- perating activities (Euro 293 million) enabled the Group to fund it s capit al
expendit ure for the period (Euro 187.8 million), to pay dividends (Euro 6.4 million), t o reduce its bank borrowing by Euro 103.9 million and to increase its cash and cash equivalent by Euro 201.4 million at Oct ober 31, 2011. Dividends distribut ed to S hareholders totaling Euro 35 million were settled as follows: Euro 32.5 million offset against receivables from parent company PRADA Holding bv and Euro 2.5 million paid in cash.
Analysis of capital expenditure
Taken t ogether, Propert y, plant and equipment and Intangible assets showed a net increase of Euro 81.6 million. Investments incurred during t he period amounted to Euro 178.1 million and were distributed as follows: Euro 111.0 million in the ret ail area, Euro 47.1 million in the industrial and logistics area
SLIDE 25 25
and Euro 20.0 million in the corporate area. Depreciat ion charges for t he period totaled Euro 92 million and write-downs amounted to Euro 2.2 million.
Outlook
The strong result s achieved also in this quarter confirm the Group’ s abilit y to sust ain high-growth rates while improving operat ing margins. The Group remains confident in the luxury market pot ential, especially in fast-growing count ries, and will cont inue to pursue it s long-t erm growth st rategy focused on the expansion of it s DOS net work, leveraging the st rength of its brands and the high quality of it s products. Nevert heless, given the present level of uncert ainty on global markets, the management will continue to monitor local and global t rends in order to prompt ly react as in the past.
Corporate Governance Practices
Audit Committee
The Audit Committee, which comprises t hree independent non-executive direct ors, on November 29, 2011 has reviewed the unaudit ed consolidated results of t he Company and it s subsidiaries for the nine months ended Oct ober 31, 2011.
Compliance with the Code on Corporate Governance Practices
The Board has reviewed the Company’ s corporate governance practices and is sat isfied that the Company has complied with the code provisions set out in the Code on Corporate Governance Practices cont ained in Appendix 14 of t he Listing Rules during t he three months ended October 31, 2011.
Coe Co
Purchase, Sale, or Redemption of the Company’s Listed Securities
Neither t he Company nor any of its subsidiaries has purchased, sold or redeemed any of the Company’ s listed securities during t he three months ended October 31, 2011.
SLIDE 26 26
Publication of Announcement on consolidated results for the nine months ended October 31, 2011
This announcement on t he consolidated results for the nine months ended Oct ober 31, 2011 is published
the Company’ s websit e at www.pradagroup.com and on the Hong Kong Exchanges and Clearing Limited’ s website at www.hkexnews.hk. By Order of t he Board PRADA S.p.A.
Deputy Chairman Milan (Italy), November 29, 2011 As at the date of this announcement, the Company’ s executive directors are
- Ms. Miuccia PRADA BIANCHI, Mr. Patrizio BERTELLI, Mr. Carlo MAZZI and Mr.
Donatello GALLI; the Company’ s non-execut ive directors are Mr. Marco S ALOMONI and Mr. Gaet ano MICCICHÈ and the Company’ s independent non- executive direct ors are Mr. Gian Franco Oliviero MATTEI, Mr. Giancarlo FORES TIERI and Mr. S ing Cheong LIU.