
SLIDE 1
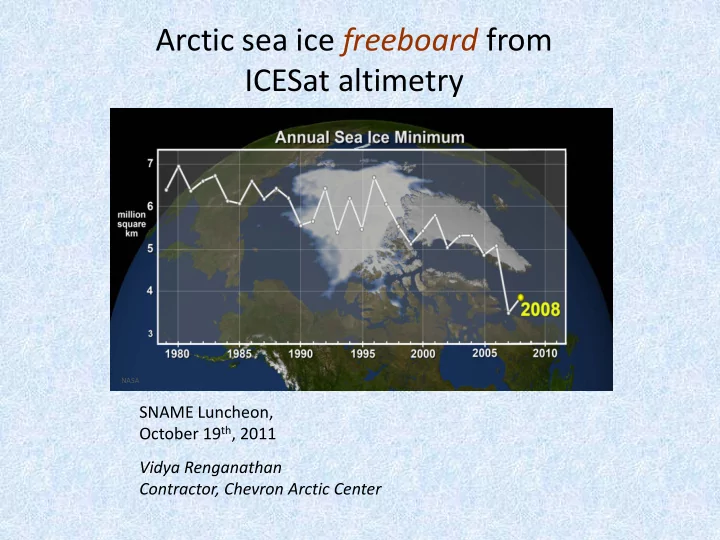
Arctic sea ice freeboard from ICESat altimetry
SNAME Luncheon, October 19th, 2011 Vidya Renganathan Contractor, Chevron Arctic Center
NASA
Arctic sea ice freeboard from ICESat altimetry NASA SNAME - - PowerPoint PPT Presentation
Arctic sea ice freeboard from ICESat altimetry NASA SNAME Luncheon, October 19 th , 2011 Vidya Renganathan Contractor, Chevron Arctic Center Changing ice conditions What is also important is the ice thickness, its distribution and its
NASA
2
3
4
UNEP Chevron Arctic Center
5
I ce force 4 1 1 0 m Base Friction h Line of excavation
Native sand
Bottom force
Chevron Arctic Center
6
7
NASA
8
Range (Snow)
Chevron Arctic Center
9
Range (Snow)
Chevron Arctic Center
10
Snow surface Tides + Mean Dyn Topo
Snow depth Freeboard
Geoid
Chevron Arctic Center
11
12
DNSC
13
14
Surface Type ICESat – Precise leveling (m)
Wetlands 0.60 Runway 0.20 Boreal forests 0.90 Coast > 1.0 Tidal flats 0.30
Surface Type ICESat – GPS RTK (m) Sea ice < 0.10
15
HEM data: Christian Haas, U of A
16
17
18
19