= - = area affected nanocomposite resistivity more B H R - - PDF document

area affected nanocomposite resistivity more b h r f d 1
SMART_READER_LITE
LIVE PREVIEW

= - = area affected nanocomposite resistivity more B H R - - PDF document

18 TH INTERNATIONAL CONFERENCE ON COMPOSITE MATERIALS PREDICTION OF TWO-DIMENSIONAL ELECTRICAL CONDUCTIVITY OF GRAPHENE/POLYMER COMPOSITES M. S. Kim 1 , J. I. Song 2 * Y. B. Park 1 * 1 School of Mechanical & Advanced Materials Engineering,


slide-1
SLIDE 1

18TH INTERNATIONAL CONFERENCE ON COMPOSITE MATERIALS

1 Introduction Graphene, like other carbon-based nanomaterials, has excellent physical properties, including mechanical and electrical properties [1,2]. With its extraordinary physical properties, graphene has initiated intensive and diverse research on various engineering systems [2-4]. One of graphene applications is integrating graphene sheets into a polymer to improve physical properties of the polymer [3,4]. Lu et al. [3] prepared a conductive nanocomposite by adding exfoliated graphite nanosheets to high-density polyethylene and investigated piezoresistive behavior

  • f

the nanocomposites. They

  • bserved

that the piezoresistivity strongly depended

  • n

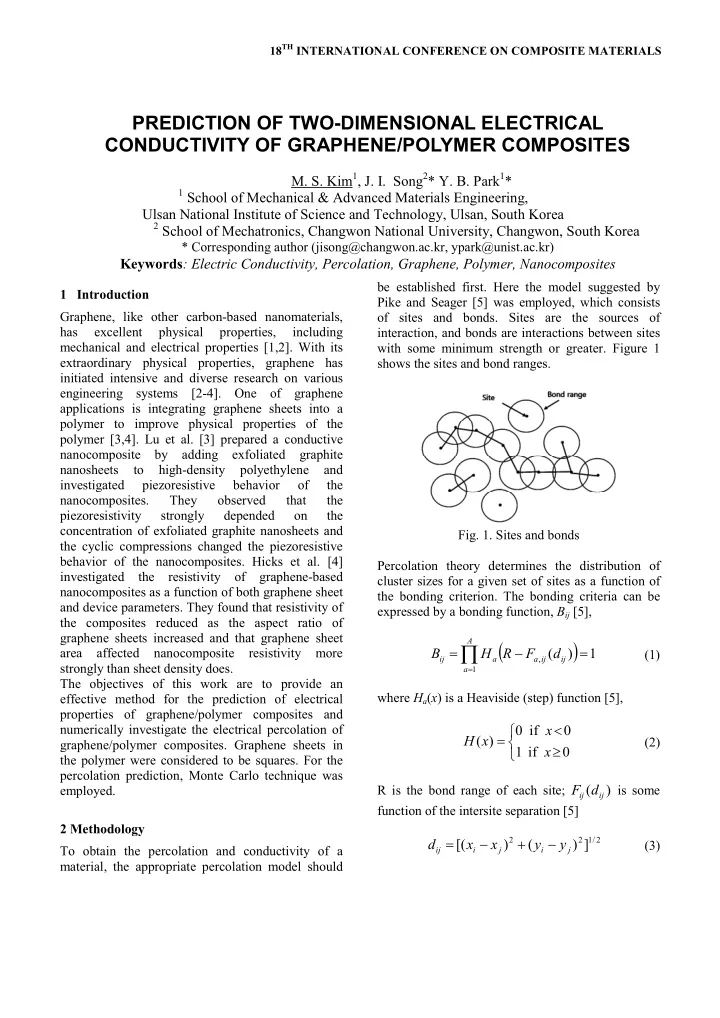
the concentration of exfoliated graphite nanosheets and the cyclic compressions changed the piezoresistive behavior of the nanocomposites. Hicks et al. [4] investigated the resistivity of graphene-based nanocomposites as a function of both graphene sheet and device parameters. They found that resistivity of the composites reduced as the aspect ratio of graphene sheets increased and that graphene sheet area affected nanocomposite resistivity more strongly than sheet density does. The objectives of this work are to provide an effective method for the prediction of electrical properties of graphene/polymer composites and numerically investigate the electrical percolation of graphene/polymer composites. Graphene sheets in the polymer were considered to be squares. For the percolation prediction, Monte Carlo technique was employed. 2 Methodology To obtain the percolation and conductivity of a material, the appropriate percolation model should be established first. Here the model suggested by Pike and Seager [5] was employed, which consists

  • f sites and bonds. Sites are the sources of

interaction, and bonds are interactions between sites with some minimum strength or greater. Figure 1 shows the sites and bond ranges.

  • Fig. 1. Sites and bonds

Percolation theory determines the distribution of cluster sizes for a given set of sites as a function of the bonding criterion. The bonding criteria can be expressed by a bonding function, Bij [5],

( ) 1

) (

, 1

=

= ij ij a A a a ij

d F R H B

(1) where Ha(x) is a Heaviside (step) function [5],

î í ì ³ < = if 1 if ) ( x x x H

(2) R is the bond range of each site;

) (

ij ij d

F

is some function of the intersite separation [5]

2 / 1 2 2

] ) ( ) [(

j i j i ij

y y x x d

  • +
  • =

(3)

PREDICTION OF TWO-DIMENSIONAL ELECTRICAL CONDUCTIVITY OF GRAPHENE/POLYMER COMPOSITES

  • M. S. Kim1, J. I. Song2* Y. B. Park1*

1 School of Mechanical & Advanced Materials Engineering,

Ulsan National Institute of Science and Technology, Ulsan, South Korea

2 School of Mechatronics, Changwon National University, Changwon, South Korea

* Corresponding author (jisong@changwon.ac.kr, ypark@unist.ac.kr)

Keywords: Electric Conductivity, Percolation, Graphene, Polymer, Nanocomposites

slide-2
SLIDE 2

As illustrated in Fig. 2, boundary regions at the edges of the unit cell were established in order to test for percolation. Their thicknesses are the bond range R. If any two sites in opposite boundary regions have the same cluster identification number, then the composite is considered to be percolating in the direction perpendicular to that boundary [5].

  • Fig. 2. Boundary regions in a unit cell

2.1 Contacts and tunneling effect between graphene sheets for percolation Square graphene sheets with side length L were employed in this work. The grapheme sheets were considered to be scattered randomly in a 2- dimensional unit cell. Each graphene was defined by rotational angle Ɵ, a center point C (xc, yc) and four corner points P1 (x1, y1), P2 (x2, y2), P3 (x3, y3), and P4 (x4, y4) as shown in Fig. 3.

  • Fig. 3. Geometry definition of a graphene sheet

To use the percolation model described above for the prediction of electrical conductivity of square graphene/epoxy nanocomposites, effective bond range Re was employed. A finite number of graphene sheets were randomly placed in a representative area (unit cell) and they were

  • bserved in pairs if the pairs were contact each other
  • r not [5,6]. The effective bond range Re was
  • btained by comparing the contact number of

graphene sheets and the contact number of sites with an effective bond range. Figure 4 shows the contacts of two graphene sheets. The first case shown in Fig. 4 (a) is that one corner point of a graphene sheet is on another sheet. The case shown in Fig. 4 (b) is that one sheet is on the

  • ther sheet with no corner point on the other

graphene sheet. Figure 4 (c) shows the third case of

  • contact. In the simulation, the three contact cases

should be investigated separately. (a) (b) (c)

  • Fig. 4. Contacts of two graphene sheets

Even though graphene sheets do not contact each

  • ther, electron transport may occur due to tunneling

effect within a certain distance. Figure 5 shows the cases of adjacent graphene sheets with a certain distance, d.

  • Fig. 5. Adjacent graphene sheets

With effective range of deff = 1 nm [6,8], a cut-off function fc is introduced for tunneling effect. A step function is applied for simplicity.

î í ì £ > =

eff eff c

d d d d d f if 1 if ) (

(4) where d is the distance between adjacent graphene sheets as shown in Fig. 5.

slide-3
SLIDE 3

2.2 Algorithm The simulation algorithm is as follows: (a) Obtain relation between side length of square graphene and effective bond range Re using relation illustrated in Figs. 4 and 5. Equation (5) is the obtained relation (Refer to Section 3.1 for details) (b) Generate square graphene sheets. The second step of the simulation was generating square graphene sheets randomly until volume fraction (vf) of graphene sheets reached a desired vf, and then obtaining the number of graphene at the desired vf and effective bond range Re using

  • Eq. (5).

(c) Generate sites in a unit cell. Once the number of graphene sheets at a desired volume fraction was obtained, the same number

  • f sites was generated. Then, the sites in the

boundary regions were checked. (d) Investigate the connection between the sites. The fourth step of the algorithm was to investigate the connection between the sites, so that connected graphene sheets were defined in a same cluster. (e) Check percolation. As mention previously, if any two sites in

  • pposite boundary regions had a same cluster

identification number, then the composite was considered to have a connected network for electric conduction. (f) Repeat from (b) to (e) 500 times to obtain percolation probability. 3 Simulation Results 3.1 Effective bond range, Re To observe the relation between side length of square graphene and effective bond rang Re, 5000 pairs of square graphenes at each side length were generated in a 1 μm x 1 μm unit cell. The pairs of grapheme sheets were studied for their contacts by using the contact cases in Figs. 4 and 5. Similarly, 5000 pairs of sites were set up and searched for effective bond range for each side length of graphene by comparing contact numbers of the square graphene sheets and sites. The result is shown in Fig. 6. The effective bond range Re increases linearly with the increase of side length L of square graphene sheet.

019 . 7071 .

  • ´

= L Re

(5)

  • Fig. 6. The relation between side length L of square

graphene sheet and effective bonding range Re 3.2 Percolation Probability The 1 μm x 1 μm unit cell of was employed in the numerical simulation for percolation probability. Table 1 lists the number of square graphene sheets with volume fractions, and Fig. 7 demonstrates percolation probability with respect to volume fractions of graphene. As shown in the table and figure, higher volume fractions exceed 1. Randomly distributed grapheme sheets easily overlap with

  • ther graphenes in the unit cell as shown in Fig. 4.

Graphene’s overlapping was not considered in the calculation of volume fraction. For example, for the two overlapping graphene sheets in Fig. 4 (b), the areas of two graphene sheets were added in the calculation of volume fraction. As such, the

  • verlapped parts of the sheets were added twice.

This kind of multiple addition of overlapping parts

  • ccurred in the entire unit cell. If, however, the

volume fraction is obtained in 3-dimensional unit cell, which is the next work of this research, the volume fraction will not exceed 1 due to the thickness of 3-dimensional composites. The percolation in Fig. 7 depends highly on the volume fraction of graphene sheets. The percolation probability increases as the volume fraction of graphene sheets in the composites increases. Percolation threshold is between volume fractions of 0.3 and 1.1. Interestingly, as the side length of graphene increases, wide transition area is observed. The transition area of nanocomposites with graphene side length of 20 nm starts at 0.6 and ends at 0.9 in

slide-4
SLIDE 4

volume fraction. However, the percolation threshold

  • f nanocomposites with side length of 100 nm starts

from 0.3 and ends 1.1. Table 1 Number of square grapheme sheets at each volume fraction vf

vf Side length (nm) 20 40 70 100 0.1 259 70 23 13 0.2 512 131 43 23 0.3 767 198 67 39 0.4 1027 263 89 46 0.5 1271 330 106 54 0.6 1544 387 132 70 0.7 1790 460 158 76 0.8 2045 527 187 89 0.9 2303 589 202 106 1.0 2565 650 219 110 1.1 2818 725 250 121 1.2 3097 790 270 134 1.3 3326 844 288 146 1.4 3587 920 321 158

  • Fig. 7 Percolation probability in terms of volume

fraction 4 Conclusion As a preliminary research for predicting the electric properties of nanocomposites in 3-dimensional volume, the percolation properties of 2-dimensional graphene/epoxy nanocomposites were studied. A percolation theory including sites and bonds was employed and Monte Carlo technique was used to predict the percolation of nanocomposites. The effective bond range Re has linear relation with the side length of graphene sheet. The percolation threshold of the nanocomposites is between volume fractions of 0.3 and 1.1. It was found that transition area was wider as the side length of graphene

  • increased. The findings in this research are expected

to facilitate a better understanding in the design of piezoresistive nanocomposite sensors. References

[1] C. Soldano, A. Mahmood and E. Dujardin, “ Production, properties and potential of graphene”, Carbon, Vol. 48, pp 2127-2150, 2010. [2] F. Scarpa, S. Adhikari and S. Phani, “Effective elastic mechanical properties of single layer graphene sheets”, Nanotechnology, Vol. 20, pp 1-11, 2009. [3] J. Lu, X. Chen, W. Lu and G. Chen, “The piezoresistive behaviors

  • f

polyethylene/foliated graphite nanocomposites”, European Polymer Journal, 42, pp 1015-1021, 2006. [4] J. Hicks, A. Behnam and A. Ural, “A computational study of tunneling-percolation electrical transport in graphene-based nanocomposites”, Applied Physics Letters, Vol. 95, pp 213103-1-3, 2009. [5] G. E. Pike and C. H. Seager, “Percolation and conductivity: A computer study. I”, Physical Review B,

  • Vol. 10, No 4, pp 1421-1434, 1974.

[6] T. C. Theodosiou and D. A. Saravanos, “Numerical investigation

  • f

mechanisms affecting the piezoresistive properties of CNT-doped polymers using multi-scale models”, Composites Science and Technology, Vol. 70, pp 1312-1320, 2010 [7] C. Li, E. T. Thostenson and T. W. Chou, “Dominant role of tunneling resistance in the electrical conductivity of carbon nanotube-based composites”, Applied Physics Letter, Vol. 91, PP 223114-1-3, 2007 [8] R. Simoes, J. Silva, R. Vaia, V. Sencadas, P. Costa, J. Gomes, and S. Lanceros-Méndez, “Low percolation transitions in carbon nanotube networks dispersed in a polymer matrix: dielectric properties, simulations and experiments”, Nanotechnology, 20, 035703-1-8, 2009.