
1
1
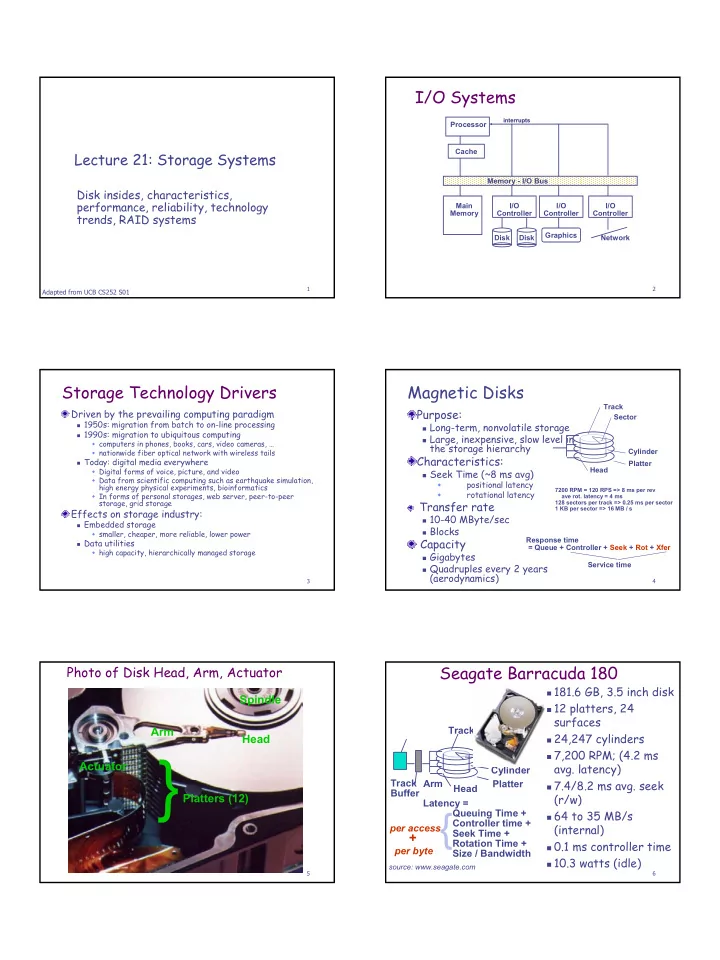
Lecture 21: Storage Systems
Disk insides, characteristics, performance, reliability, technology trends, RAID systems
Adapted from UCB CS252 S01
2
I/O Systems
Processor Cache Memory - I/O Bus Main Memory I/O Controller Disk Disk I/O Controller I/O Controller Graphics Network
interrupts interrupts 3
Storage Technology Drivers
Driven by the prevailing computing paradigm
1950s: migration from batch to on-line processing 1990s: migration to ubiquitous computing
computers in phones, books, cars, video cameras, … nationwide fiber optical network with wireless tails
Today: digital media everywhere
Digital forms of voice, picture, and video Data from scientific computing such as earthquake simulation, high energy physical experiments, bioinformatics In forms of personal storages, web server, peer-to-peer storage, grid storage
Effects on storage industry:
Embedded storage
smaller, cheaper, more reliable, lower power
Data utilities
high capacity, hierarchically managed storage
4
Magnetic Disks
Purpose:
Long-term, nonvolatile storage Large, inexpensive, slow level in
the storage hierarchy
Characteristics:
Seek Time (~8 ms avg)
- positional latency
- rotational latency
Transfer rate
10-40 MByte/sec Blocks
Capacity
Gigabytes Quadruples every 2 years
(aerodynamics)
Sector Track Cylinder Head Platter
7200 RPM = 120 RPS => 8 ms per rev ave rot. latency = 4 ms 128 sectors per track => 0.25 ms per sector 1 KB per sector => 16 MB / s
Response time = Queue + Controller + Seek + Rot + Xfer Service time
5
Photo of Disk Head, Arm, Actuator
Actuator Arm Head Platters (12)
{
Spindle
6
Seagate Barracuda 180
181.6 GB, 3.5 inch disk 12 platters, 24
surfaces
24,247 cylinders 7,200 RPM; (4.2 ms
- avg. latency)
7.4/8.2 ms avg. seek
(r/w)
64 to 35 MB/s
(internal)
0.1 ms controller time 10.3 watts (idle) source: www.seagate.com