
SLIDE 1
« Demand models with geolocalized explanatory variables » Frédérique Fève, Jean‐Pierre Florens (2016)
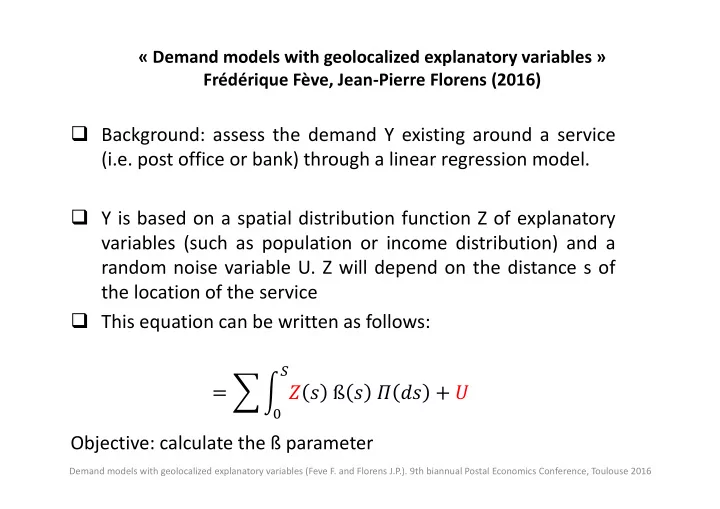
Background: assess the demand Y existing around a service (i.e. post office or bank) through a linear regression model. Y is based on a spatial distribution function Z of explanatory variables (such as population or income distribution) and a random noise variable U. Z will depend on the distance s of the location of the service This equation can be written as follows: ß
- Objective: calculate the ß parameter