Workshop for Solar Energy and Smart Grid Development, Asian Development Bank, Regional Task Force [1] 13-15 September 2011, Jodhpur, Rajasthan, India
Bankable solar resource assessment and risk management in planning - - PowerPoint PPT Presentation
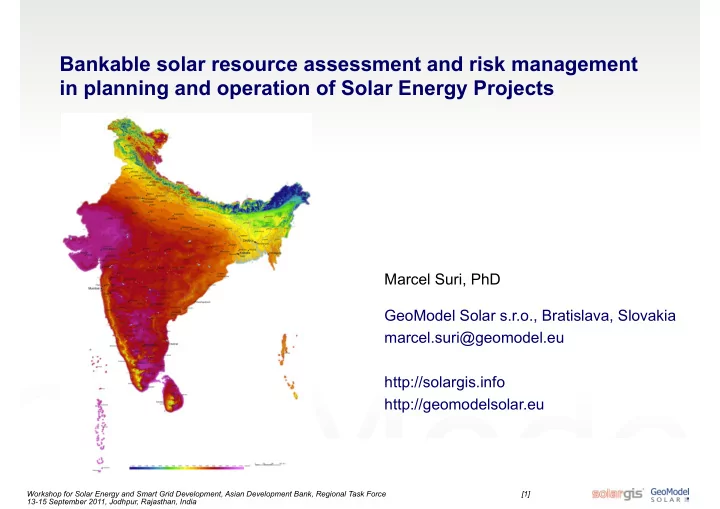
Bankable solar resource assessment and risk management in planning and operation of Solar Energy Projects Marcel Suri, PhD GeoModel Solar s.r.o., Bratislava, Slovakia marcel.suri@geomodel.eu http://solargis.info http://geomodelsolar.eu
Workshop for Solar Energy and Smart Grid Development, Asian Development Bank, Regional Task Force [2] 13-15 September 2011, Jodhpur, Rajasthan, India
About GeoModel Solar
Expert consultancy:
- Solar resource assessment and PV yield prediction
- Performance characterization
- Country optimization potential
- Grid integration studies
SolarGIS: Real-time solar and meteo data services for:
- Site selection and prefeasibility
- Planning and project design
- Monitoring and forecasting of solar power
- Solar data infrastructure
http://geomodelsolar.eu http://solargis.info
European Commission PVGIS 2001-2008 SolarGIS from 2008
Workshop for Solar Energy and Smart Grid Development, Asian Development Bank, Regional Task Force [3] 13-15 September 2011, Jodhpur, Rajasthan, India
International collaboration
International Energy Agency, Solar Heating and Cooling Program:
- Task 36 Solar Resource Knowledge Management
- Task 46 Solar Resource Assessment and Forecasting
- EU COST Action Weather Intelligence for Renewable Energies
- EU project Management and Exploitation of Solar Resource Knowledge (finished)
- National Renewable Energy Laboratory (NREL, US)
- SUNY (US)
- DLR (DE)
- Fraunhofer ISE (DE)
- Stellenbosch University (ZA)
- University of Geneva (CH)
- European Commission JRC (IT)
- CENER (ES)
- SUPSI ISAAC (CH)
Workshop for Solar Energy and Smart Grid Development, Asian Development Bank, Regional Task Force [4] 13-15 September 2011, Jodhpur, Rajasthan, India
Bankable data = low uncertainty, high reliability
Solar resource estimate
- High quality ground measurements of solar radiation missing
- Diverse results from the existing databases
- Poor understanding of the potential of the modern satellite-derived data
Weather interannual variability
- Long and continuous record of data is needed (10+ years)
- Changing weather (natural and human induced) and extreme events
(e.g. volcanoes) to be considered
- In the recent history
- In the future
Uncertainty in solar resource assessment
Workshop for Solar Energy and Smart Grid Development, Asian Development Bank, Regional Task Force [5] 13-15 September 2011, Jodhpur, Rajasthan, India
Solar resource – requirements for solar projects
Data available at any location Long-climate record (10 years minimum) Cleaned, validated, harmonized and without gaps High accuracy, low uncertainty (no systematic errors, good representation) High level of detail (temporal, spatial) Modern data products (time series, TMY, long-term averages) Standardized data formats Real-time data supply:
- historical
- monitoring
- nowcasting
- forecasting
+ Meteo and other geodata for energy modeling (temperature, wind, humidity)
All this is possible with satellite-based data, supported by high-quality ground measurements!
Workshop for Solar Energy and Smart Grid Development, Asian Development Bank, Regional Task Force [6] 13-15 September 2011, Jodhpur, Rajasthan, India
Solar resource – how to obtain site-specific information
Ground instruments (interpolation/extrapolation) Satellite-based solar data (solar radiation models & atmospheric data)
WRDC network (~1200 archive stations) sources: NASA, EUMETSAT, Stoffel et al. 2010 sources: NREL, WRDC
Workshop for Solar Energy and Smart Grid Development, Asian Development Bank, Regional Task Force [7] 13-15 September 2011, Jodhpur, Rajasthan, India
Available solar databases - Gujarat
The databases differ in many aspects:
- Input data (satellite/ground)
- Applied methods/models
- Time coverage (period)
- Time and spatial resolutions
GHI >10% more for DNI!
Workshop for Solar Energy and Smart Grid Development, Asian Development Bank, Regional Task Force [8] 13-15 September 2011, Jodhpur, Rajasthan, India
Ground instruments
ADVANTAGES LIMITATIONS High accuracy at the point of measurement High frequency measurements (sec. to min.) High-quality data THIS APPLIES ONLY IN THE CONTROLLED AND RIGORIUSLY MANAGED CONDITIONS Historical data: Limited time of measurement Limited number of sites Unknown accuracy (in historical data) Different periods of measurement … Operation of a ground station: Regular maintenance and calibration Data management Issues of aggregation statistics High costs for acquisition and operation Extrapolation/interpolation ignores site-specific info
source: Gueymard 2010AWI
Workshop for Solar Energy and Smart Grid Development, Asian Development Bank, Regional Task Force [9] 13-15 September 2011, Jodhpur, Rajasthan, India
Uncertainty in ground observations
Issues
- Sensors accuracy
- Installation and maintenance routines
- Cleaning of the sensor
- Calibration
- Time shifts, shading
Needed procedures
- Data post-processing
- Quality checking (only high-frequency data!)
- Filling the gaps in the measurements
- Missing data results in skewed aggregation statistics (e.g. daily and monthly sums)
- High probability of systematic deviation (BIAS) and occurrence of extreme values
- Uncleaned data result in unreliable values
Workshop for Solar Energy and Smart Grid Development, Asian Development Bank, Regional Task Force [10] 13-15 September 2011, Jodhpur, Rajasthan, India
Solar radiation models: satellite-derived data
ADVANTAGES LIMITATIONS Available everywhere (continuous coverage) Spatial resolution from 3 km Frequency of measurements from 15 minutes Spatial and temporal consistency High calibration stability Availability ~99.5% History of up to 20 years Continuous geographical coverage (global) Lower instantaneous accuracy for the point estimate (when compared to high quality ground measurements)
Data sources: EUMETSAT, ECMWF Source: SolarGIS
Workshop for Solar Energy and Smart Grid Development, Asian Development Bank, Regional Task Force [11] 13-15 September 2011, Jodhpur, Rajasthan, India
Uncertainty in satellite-derived DNI and GHI
Clouds Aerosols Water vapour Terrain
DNI 0 to 100% ±10% (up to ± 50%) ±3 to 4% 100% GHI 0 to 80% ±2 to 3% (up to ± 12%) ±0.5 to 1% 60 to 80% Highest uncertainty
Atmosperic Optical Depth Water vapour Clouds Terrain
Workshop for Solar Energy and Smart Grid Development, Asian Development Bank, Regional Task Force [12] 13-15 September 2011, Jodhpur, Rajasthan, India
AERONET MACC GEMS
Kanpur Uncertainty of Aerosol Optical Depth (AOD)
MACC model compared to ground measured AERONET data
Critical for DNI
Workshop for Solar Energy and Smart Grid Development, Asian Development Bank, Regional Task Force [13] 13-15 September 2011, Jodhpur, Rajasthan, India
Typical uncertainty of ground-measured vs. satellite-derived solar data
GHI
Thermopile pyranometer Satellite ISO Classification Secondary Standard First Class Second Class WMO Classification High Quality Good Quality
- Mod. Quality
RMSD Bias Hourly uncertainty 3% 8% 20% 9-20% ±2-7% Daily uncertainty 2% 5% 10% 4-12% bias depends on the calibration and maintenance
DNI
Thermopile pyrheliometer RSR Satellite WMO Classification High quality Good quality RMSD Bias Hourly uncertainty 0.7% 1.5% 2-4% 24-60% ±4-12% Daily uncertainty 0.5% 1.0% 1.5% 15-25%
Bias:
- It is natural for satellite-derived data and can be reduced/removed
- For ground-measured data it is very challenging and costly to keep bias
close to 0
Workshop for Solar Energy and Smart Grid Development, Asian Development Bank, Regional Task Force [14] 13-15 September 2011, Jodhpur, Rajasthan, India
Typical uncertainty of ground-measured vs. satellite-derived solar data
GHI
Thermopile pyranometer Satellite ISO Classification Secondary Standard First Class Second Class WMO Classification High Quality Good Quality
- Mod. Quality
RMSD Bias Hourly uncertainty 3% 8% 20% 9-20% ±2-7% Daily uncertainty 2% 5% 10% 4-12% bias depends on the calibration and maintenance
DNI
Thermopile pyrheliometer RSR Satellite WMO Classification High quality Good quality RMSD Bias Hourly uncertainty 0.7% 1.5% 2-4% 24-60% ±4-12% Daily uncertainty 0.5% 1.0% 1.5% 15-25%
GHI:
- satellite already competitive in RMSD with good-quality sensors
Workshop for Solar Energy and Smart Grid Development, Asian Development Bank, Regional Task Force [15] 13-15 September 2011, Jodhpur, Rajasthan, India
Typical uncertainty of ground-measured vs. satellite-derived solar data
GHI
Thermopile pyranometer Satellite ISO Classification Secondary Standard First Class Second Class WMO Classification High Quality Good Quality
- Mod. Quality
RMSD Bias Hourly uncertainty 3% 8% 20% 9-20% ±2-7% Daily uncertainty 2% 5% 10% 4-12% bias depends on the calibration and maintenance
DNI
Thermopile pyrheliometer RSR Satellite WMO Classification High quality Good quality RMSD Bias Hourly uncertainty 0.7% 1.5% 2-4% 24-35% ±4-12% Daily uncertainty 0.5% 1.0% 1.5% 15-25%
DNI:
- It is very challenging to keep high standard of DNI ground measurements
- Satellite data can be correlated with ground measurements to obtain improved
site solar statistics
Workshop for Solar Energy and Smart Grid Development, Asian Development Bank, Regional Task Force [16] 13-15 September 2011, Jodhpur, Rajasthan, India
- 16 -
- Four stations compared in Germany and Netherlands
- Calibration issue identified (Ineichen 2011)
Quality checking of ground measurements using SolarGIS
Workshop for Solar Energy and Smart Grid Development, Asian Development Bank, Regional Task Force [17] 13-15 September 2011, Jodhpur, Rajasthan, India
Accuracy and representativeness: Distribution of values
Comparison of distributon
- f DNI clearness index:
- measured (yellow)
- satellite-derived (blue)
Proper distribution statistics plays key role in energy simulation
Source: IEA SHC Task 36 data inter-comparison activity, Pierre Ineichen, University of Geneva, February 2011: http://www.unige.ch/cuepe/pub/ineichen_valid-sat-2011-report .pd
SolarGIS
Workshop for Solar Energy and Smart Grid Development, Asian Development Bank, Regional Task Force [18] 13-15 September 2011, Jodhpur, Rajasthan, India
Ground-measured vs. satellite-derived
Distance to the nearest meteo stations – interpolation gives only approximate estimate
Source: SolarGIS
Resolution of the input data used in the SolarGIS model:
AOD: Atmospheric Optical Depth WV: Water Vapour MFG/MSG: Meteosat First/Second Generation
Workshop for Solar Energy and Smart Grid Development, Asian Development Bank, Regional Task Force [19] 13-15 September 2011, Jodhpur, Rajasthan, India
Annual DNI average in India source: SolarGIS
SUMMARY: Ground vs. satellite-based solar data
- Solar data are site specific
- High variability and intermittency
- Ground data are not able to represent
geographical and time diversity of solar climate
- It is important to use high-quality satellite
combined with ground data
Workshop for Solar Energy and Smart Grid Development, Asian Development Bank, Regional Task Force [20] 13-15 September 2011, Jodhpur, Rajasthan, India
Interannual variability: Northwest India
Interannual variability is driven by:
- Natural climate cycles
- Change of aerosols (human factor)
- Climate change (long-term trends)
- Occasional large volcanic eruptions
Assuming years 1999-2010: Average Minimum GHI: 2035 1964 (-4.5%) DNI: 1764 1621 (-8.1%)
Workshop for Solar Energy and Smart Grid Development, Asian Development Bank, Regional Task Force [21] 13-15 September 2011, Jodhpur, Rajasthan, India
Ground measurements available for a short time period (few months, 1-2 years) They are correlated with time series of satellite-derived irradiance to:
- Correct systematic errors (reduce bias)
- Match data frequency distribution
Site adaptation of satellite-based time series is needed for LARGE PROJECTS
Workshop for Solar Energy and Smart Grid Development, Asian Development Bank, Regional Task Force [22] 13-15 September 2011, Jodhpur, Rajasthan, India
Original DNI “ground – satellite” data scatterplot: Bias: -4.2% Correction of bias and frequency distribution
Example: Tamanrasset (Algeria)
Site adaptation of satellite-based time series
- Modern high-resolution satellite-based solar models offer solar resource
information at high detail and quality
- New ground measurements will help to reduce uncertainty
Workshop for Solar Energy and Smart Grid Development, Asian Development Bank, Regional Task Force [23] 13-15 September 2011, Jodhpur, Rajasthan, India
Ground data
- Important for validation, and site-adaptation of the satellite-derived data (reference data)
- Only quality sensors and properly managed measurement campaign
- It is challenging to achieve high quality and continuity of measurements
Satellite-based data
- Global coverage, high frequency high detail
- High temporal and spatial resolution
- Harmonized, radiometricaly stable, no gaps
- Continuous history of 12+ years in India
To reduce uncertainty, combine ground measurements with satellite data
Summary: uncertainty in solar resource data
Workshop for Solar Energy and Smart Grid Development, Asian Development Bank, Regional Task Force [24] 13-15 September 2011, Jodhpur, Rajasthan, India
Is the solar resource prediction for 20 years right?
- Only high quality data – averaging bad numbers cannot yield in a good assessment
- Robust and long history for interannual variability
- Average does not say much – go for annual and monthly P(50), P(75) and P(90)
- Analytics of possible issues (shading, aerosols, mountains, coastal zone, desert geography, etc.)
- Only solar resource experts
Is the solar power plant performing as expected?
- Use recent high quality and continuous measurements
- Cross-validated (sat-ground) data
- Site-adapted data
- Compare solar resource to validated performance data
How to reduce risk?
Workshop for Solar Energy and Smart Grid Development, Asian Development Bank, Regional Task Force [25] 13-15 September 2011, Jodhpur, Rajasthan, India
SolarGIS: online system for solar energy and PV
- Access to SolarGIS historical and real-time data (automatic and interactive)
- Maps and prospecting tools
- PV planning and optimization
- PV monitoring & performance assessment
- PV forecasting
http://solargis.info
Workshop for Solar Energy and Smart Grid Development, Asian Development Bank, Regional Task Force [26] 13-15 September 2011, Jodhpur, Rajasthan, India