
SLIDE 1
181
Being a Market Chameleon Being a Market Chameleon
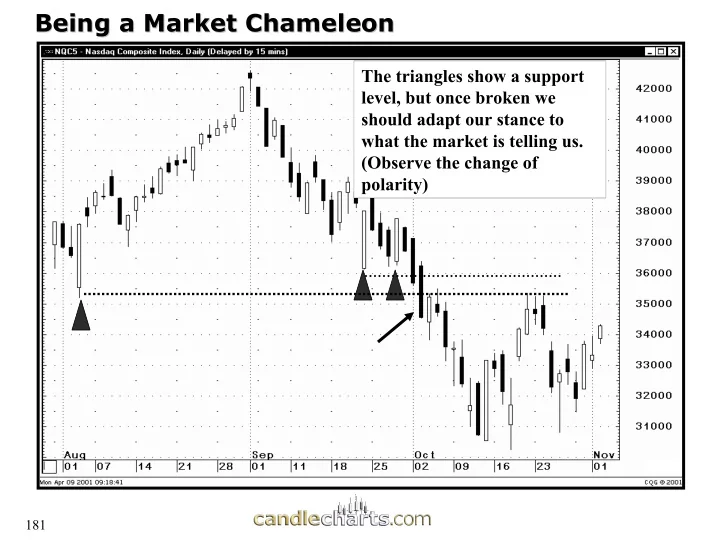
The triangles show a support level, but once broken we should adapt our stance to what the market is telling us. (Observe the change of polarity)
Being a Market Chameleon Being a Market Chameleon The triangles - - PowerPoint PPT Presentation
Being a Market Chameleon Being a Market Chameleon The triangles show a support level, but once broken we should adapt our stance to what the market is telling us. (Observe the change of polarity) 181 Adapting to the market Adapting to the
181
Being a Market Chameleon Being a Market Chameleon
The triangles show a support level, but once broken we should adapt our stance to what the market is telling us. (Observe the change of polarity)
182
Adapting to the market Adapting to the market
Normally we look for the lows of the bullish engulfing pattern as support. In this case once the hammer is formed (at the arrow) we then adjust our buy point to the hammer’s support area.
183
If the market does not act as forecasted then exit the position exit the position Initiate a position when the market justifies your potential trade (i.e. if near resistance, If the market breaks above resistance, Then one can buy.
183
184
If….Then Rule (slide 1 of 2) Head and Shoulders Top?
185
If….Then Rule (slide 2 of 2) Was Head and Shoulders Top Confirmed ?
186
If….Then Rule
The bullish ascending triangle and the new high close for the move strongly hints that the market will break out. But resistance held.
Candlecharts.com
187
188
Initiate new trades in the direction of Initiate new trades in the direction of the major trend (unless you are looking the major trend (unless you are looking for a small move): for a small move):
On bullish signals in a bull market buy long. On bullish signals in a bear trend, cover shorts. signals in a bear trend, cover shorts.
On bearish signals in a bear trend, sell short. On bearish signals in a bull market, liquidate longs. signals in a bull market, liquidate longs.
189
Battle of the Windows – slide 1 of 2
Rising window as support (also a breakaway gap)
Falling window as resistance Is there a way to forecast which way the market will break out?
190
Go with the trend –slide 2 of 2
Based on the market holding above this 30 period moving average the odds favor a breakout to the upside
Rising Window Falling window
191
Importance of Trend
Concept: place trade in direction of prevailing trend. Since this is down we should look for bounce from bullish engulfing pattern and then sell short at change of polarity.
Change of Polarity
Resistance zone
192
Go in the direction of the prevailing trend
Rising windows
The bullish rising windows are within a bear trend. This warrants covering shorts at the window’s support, rather than placing new long trades (unless you are just looking for a small bounce)
Long upper shadows and spinning tops are warning signals
193
Candlecharts.com
194
Candlecharts.com
195
196
Candles in Context Candles in Context
Would you buy on this hammer?
197
Patterns in Context Patterns in Context – – bullish signal at resistance
bullish signal at resistance
Although there was a bullish engulfing pattern, this potentially bullish signal came at a resistance level at the small falling window window
198
4 bruary 5 6 7 8 11 12 13 14 15 19 20 21 22 25 26 27 28 1 March 4 5 6 7 8 36.5 37.0 37.5 38.0 38.5 39.0 39.5 40.0 40.5 41.0 41.5 42.0 42.5 43.0 43.5 44.0 44.5 45.0 TRIBUNE CO
Candle Signals within market context Candle Signals within market context
Below the stomach pattern is the rising window keeps the uptrend intact.
199
Candles in Context Candles in Context
What are two reasons not to sell
200
Candles in Context Candles in Context
Hammer, but??