
SLIDE 1
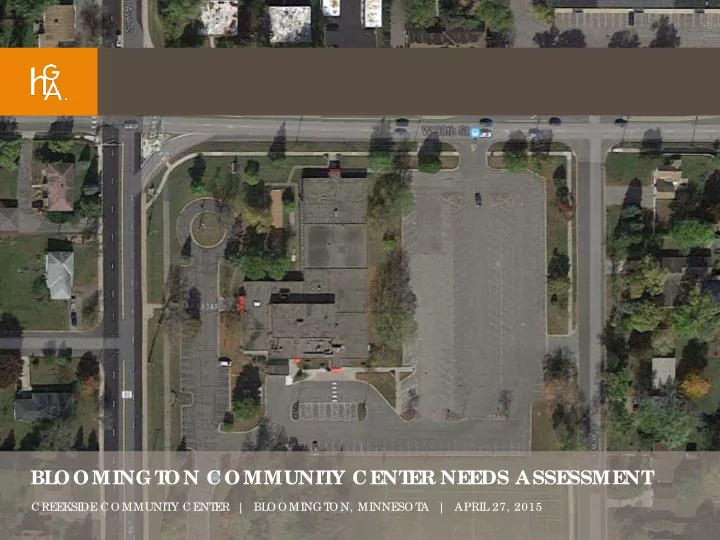
C REEKSIDE C O MMUNIT Y C ENT ER | BLO O MING T O N, MINNESO T A | APRIL 27, 2015
BL O O MING T O N CO MMUNIT Y CENT ER NEEDS ASSESSMENT
BL O O MING T O N CO MMUNIT Y CENT ER NEEDS ASSESSMENT C - - PowerPoint PPT Presentation
BL O O MING T O N CO MMUNIT Y CENT ER NEEDS ASSESSMENT C REEKSIDE C O MMUNIT Y C ENT ER | BLO O MING T O N, MINNESO T A | APRIL 27, 2015 Sta ke ho ld e rs a nd De sig n T e a m Ne e d s Asse ssme nt Pro c e ss C re e ksid
C REEKSIDE C O MMUNIT Y C ENT ER | BLO O MING T O N, MINNESO T A | APRIL 27, 2015
BL O O MING T O N CO MMUNIT Y CENT ER NEEDS ASSESSMENT
AG ENDA
► Sta ke ho ld e rs a nd De sig n T
► Ne e d s Asse ssme nt Pro c e ss ► C re e ksid e Eva lua tio n ► Ma rke t Ana lysis ► Re c o mme nd e d p ro g ra m ► C o st e stima te ► Ne xt ste p s
City of Blooming ton
►
Dia nn Kirb y
►
C o mmunity Se rvic e s Dire c to r
►
Ra nd y Q ua le
►
Ma na g e r o f Pa rks & Re c re a tio n
►
G re g Bo a tma n
►
►
L
►
Ma na g e r o f Huma n Se rvic e s
►
T ra c y Smith
►
Ad ministra tive C o o rd ina to r fo r Huma n Se rvic e s
►
Jim Eile r
►
Ma inte na nc e Sup e rinte nd e nt
►
Bo nnie Pa ulse n
►
Pub lic He a lth Ad ministra tio n
De sig n/ Consulta nts
►
Na nc y Bla nkfa rd , AIA
►
HG A Arc hite c ts a nd Eng ine e rs – Princ ip a l, Pro je c t Ma na g e r
►
Emilie Ko p p
►
HG A Arc hite c ts a nd Eng ine e rs - Inte rn
►
Je ff King
►
Ba lla rd *King - C o nsulta nt
►
Vic to r Pe c ha ty, AIA
►
HG A Arc hite c ts a nd Eng ine e rs – De sig n Princ ip a l
►
Ma rk Mc Do na ld
►
HG A Arc hite c ts a nd Eng ine e rs – C o st Estima ting
ST AKEHO L DERS & DESIG N T EAM
Community Input Sta ke holde rs
►
L
►
Se nio r C o mmunity Se rvic e s
►
Mo to r Ve hic le s
►
Blo o ming to n Unite d fo r Yo uth
►
Mid we st Pic kle b a ll
►
Fa stp itc h ST AKEHO L DERS & DESIG N T EAM
►
Blo o ming to n Athle tic Asso c ia tio n
►
Blo o ming to n Yo uth So c c e r
►
T ra ve ling Ba se b a ll
►
Blo o ming to n Pub lic Sc ho o ls
►
Yo uth L a c ro sse
►
C re e ksid e se nio r le a d e rs
►
C a thy Ma e s, Lo a ve s & Fishe s
►
De b Ho g e r, Se nio r C o mmunity Se rvic e s
►
Kim G riffith, Mo to r Ve hic le s
►
Ja ne t Le wis, Mo to r Ve hic le s
►
Jing Jing Ze ng , Blo o ming to n Unite d fo r Yo uth
►
Mic ha e l Re inha rd t, Blo o ming to n Unite d fo r Yo uth
►
T
►
Ric ha rd C a rte r, Mid we st Pic kle b a ll
►
T im Fo rb y. Blo o ming to n Yo uth So c c e r
►
Ka re n Jo hnso n, Fa stp itc h
►
Ma rk Pe a rso n, Fa stp itc h
►
Wa yne Ha e g , Blo o ming to n Athle tic Asso c ia tio n
►
Jo hn He lme r, T ra ve ling Ba se b a ll
►
Do ug La ng e fe ls, Blo o ming to n Pub lic Sc ho o ls
►
Jim Mc C a rthy, Yo uth La c ro sse
►
C he ryl Ste p ne y, C re e ksid e C o mmunity C e nte r
►
Ro g e r Ko la nd , C re e ksid e C o mmunity C e nte r
►
Ma c k Siro is, C re e ksid e C o mmunity C e nte r
►
Le nn La c he r, C re e ksid e C o mmunity C e nte r
►
Dia ne Rile y, C re e ksid e C o mmunity C e nte r
►
Alic e O lso n, C re e ksid e C o mmunity C e nte r
►
Sa nd y Lund e e n, C re e ksid e C o mmunity C e nte r
►
Ma rylo u Nilso n, C re e ksid e C o mmunity C e nte r
►
Mic he lle Kissing e r, C re e ksid e C o mmunity C e nte r
►
Arline Ja ke ma n, C re e ksid e C o mmunity C e nte r
►
Lind a Ne lso n, C re e ksid e C o mmunity C e nte r
►
Je rry O lso n, C re e ksid e C o mmunity C e nte r
►
Ma ry We ntz, C re e ksid e C o mmunity C e nte r
►
Be ve rle y T sc hump e r, C re e ksid e C o mmunity C e nte r
►
Sha ro n Be c kle r, C re e ksid e C o mmunity C e nte r
►
G le nn Ne lso n, C re e ksid e C o mmunity C e nte r
►
Ja c k Withe rb y, C re e ksid e C o mmunity C e nte r
ST AKEHO L DERS & DESIG N T EAM
Community Input Sta ke holde rs
PRO CESS
T RENDS IN HEAL T H AND WEL L NESS
CO MMUNIT Y AT T RACT O RS
BL O O MING T O N CO MPREHENSIVE PL AN
► T
► Pro mo te the fun a nd vita lity
► Sha p e future ra the r tha n
► Pro vid e o ur c hild re n with
CO MMUNIT Y CENT ER VISIO N
► A Blooming ton Community Ce nte r is…
► A p la c e fo r g a the ring ► C o mfo rta b le a nd we lc o ming ► Huma n se rvic e s fo c use d ► Inte g ra te s c o mmunitie s ► Fo r multi-e c o no mic use rs ► Fo r multi-g e ne ra tio na l use rs ► Fo r multi-c ultura l use rs
EXIST ING CREEKSIDE CO MMUNIT Y CENT ER
EXIST ING CREEKSIDE CO MMUNIT Y CENT ER
EXIST ING CREEKSIDE CO MMUNIT Y CENT ER
► Wha t’s working we ll
► T
hriving so c ia l o p p o rtunitie s fo r se nio rs
► Vo lunte e r le d p ro g ra m o ffe rs wa ys to g ive b a c k
► Wha t ne e ds improve me nt
► Ina d e q ua te sp a c e to c o nd uc t p ro g ra ms ► Minima l fle xib ility to mo d ify ro o ms ► Sig nific a nt c o st to me e t c o d e a nd still no t me e t ne e d s
CREEKSIDE REPAIRS CO ST EST IMAT E
► Construc tion Cost to improve Cre e kside
► Ke y up g ra d e s:
► Ne w HVAC ► Wind o w re p la c e me nt ► Re stro o m a d d itio n ► Ne w e le c tric a l d istrib utio n p a ne l ► Ne w p a rking lo t a nd c urb s
2010 Census 2014 Projectio n 2019 Projectio n City of Bloomington 42.8 43.4 44.1 Secondary Service Area 40.7 41.4 42.3 State of Minnesota 37.3 37.9 38.5 Nationally 37.1 37.7 38.2
32 34 36 38 40 42 44 46 2010 2014 2019 37.1 37.7 38.2 Age City of Bloomington Secondary Service Area State of Minnesota National
2014 Estimate 2019 Projection City of Bloomington $61,129 $73,520 Secondary Service Area $62,959 $75,597 State of Minnesota $58,634 $68,448 Nationally $52,076 $59,599
$0 $10,000 $20,000 $30,000 $40,000 $50,000 $60,000 $70,000 $80,000 2014 2019 $52,076 $59,599 Median HH Income City of Bloomington Secondary Service Area State of Minnesota National
City of Bloomington SPI Average Amount Spent Percen t Housing 117 $24,464.68 30.8% Shelter 118 $18,886.95 23.8% Utilities, Fuel, Public Service 113 $5,577.73 7.0% Entertainment & Recreation 116 $3,751.84 4.7% State of Minnesota SPI Average Amount Spent Percen t Housing 108 $22,542.30 30.0% Shelter 107 $17,167.93 22.9% Utilities, Fuel, Public Service 109 $5,374.37 7.2% Entertainment & Recreation 111 $3,595.85 4.8%
Ages Populatio n % of Total Nat. Populatio n Differenc e
4,374 5.1% 6.5%
5-17 11,778 14.0% 17.2%
18-24 6,407 7.6% 9.8%
25-44 21,270 25.1% 26.5%
45-54 11,669 13.8% 14.1%
55-64 12,292 14.5% 12.3% +2.2% 65-74 8,565 10.2% 7.5% +2.7% 75+ 8,237 9.7% 6.1% +3.6% Ages 2010 Census 2014 Projecti
2019 Projecti
Percent Change Percent Change Nat’l
4,505 4,374 4,584 +1.8% +4.7% 5-17 11,858 11,778 12,185 +2.8% +1.8% 18-24 6,485 6,407 6,040
25-44 20,843 21,270 22,196 +6.5% +10.4% 45-54 12,762 11,669 10,764 -15.7%
55-64 11,222 12,292 13,112 +16.8% +13.7% 65-74 7,502 8,565 10,110 +34.8% +32.9% 75+ 7,716 8,237 9,288 +20.4% +9.5%
Activity Average 2010 Part. 2014 Part. 2019 Part. Differen ce Aerobic 15.3% 11,732 12,012 12,544 +812 Baseball 4.4% 3,372 3,452 3,605 +233 Basketball 9.0% 6,877 7,042 7,353 +476 Cheerleading 1.4% 1,034 1,059 1,105 +72 Exercise Walking 34.5% 26,417 27,048 28,244 +1,827 Exercise w/ Equipment 19.4% 14,850 15,205 15,877 +1,027 Football (tackle) 2.5% 1,906 1,951 2,038 +132 Gymnastics 1.8% 1,404 1,437 1,501 +97 Hockey (ice) 1.2% 926 948 990 +64 Lacrosse 0.7% 540 553 577 +37 Running/Jogging 14.8% 1,311 1,342 1,401 +91 Soccer 4.7% 3,579 3,665 3,827 +248 Softball 3.6% 2,790 2,857 2,983 +193 Swimming 16.1% 12,324 12,619 13,177 +853 Tennis 4.4% 3,357 3,438 3,590 +232 Volleyball 3.5% 2,712 2,777 2,899 +188 Weight Lifting 11.2% 8,563 8,767 9,155 +592 Workout @ Clubs 11.6% 8,864 9,075 9,477 +613 Wrestling 1.0% 782 801 836 +54 Yoga 9.0% 6,874 7,038 7,349 +475
Sport Nat’l Rank Nat’l Participation (in millions) Primary Service Area Primary Service Area % Participation Exercise Walking 1 96.3 1 34.5% Exercising w/ Equipment 2 53.1 2 19.4% Swimming 3 45.5 3 16.1% Aerobic Exercising 4 44.1 4 15.3% Running/Jogging 5 42.0 5 14.8% Workout @ Club 10 34.1 6 11.6% Weightlifting 11 31.2 7 11.2% Yoga 13 25.9 8 9.0% Basketball 14 25.5 8 9.0% Soccer 20 12.9 10 4.7% Tennis 21 12.6 11 4.4% Baseball 23 11.7 11 4.4% Volleyball 24 10.1 14 3.5% Softball 25 10.0 13 3.6% Football (tackle) 32 7.5 15 2.5% Gymnastics 39 5.1 16 1.8% Cheerleading 45 3.5 17 1.4% Hockey (ice) 46 3.4 18 1.2% Wrestling 48 3.1 19 1.0% Lacrosse 49 2.8 20 0.7%
Sport/Activity 2013 Participation 2004 Participation Percent Change Yoga 25.9 6.3 +311.1% Wrestling 3.1 1.3 +138.5% Lacrosse 2.8 1.2 +133.3% Running/Jogging 42.0 24.7 +70.0% Aerobic Exercising 44.1 29.5 +49.5% Hockey (ice) 3.5 2.4 +45.8% Tennis 12.6 9.6 +31.3% Gymnastics 5.1 3.9 +30.8% Weightlifting 31.3 26.2 +19.5% Exercise Walking 96.3 84.7 +13.7% Workout @ Club 34.1 31.8 +7.2% Exercising w/ Equipment 53.1 52.2 +1.7% Soccer 12.8 13.3
Volleyball 10.1 10.8
Basketball 25.5 27.8
Football (tackle) 7.5 8.2
Cheerleading 3.5 4.1
Swimming 45.5 53.4
Softball 10.0 12.5
Baseball 11.7 15.9
Alternative Providers & Trends Market Analysis CCC, Community & Staff Input
Recreation Amenities versus Revenue Production
meter)
Potential Medium Revenues
Potential Low Revenues
Potential High Revenues
Source: BALLARD*KING and ASSOCIATES
Full Time Staff 773,230 Part Time Staff 503,811 Equipment Maintenance 8,500 Mobile Devices 6,500 Mileage 500 Training and Education 3,500 IS System Maintenance 62,000 IS Replacement 30,000 Web Access 1,500 Space and Occupancy 253,500 Building Replacement 350,000 Postage 5,000 Telephone 12,500 Printing 9,000 Office Supplies 12,500 Merchandise for Sale 3,000 Recreation Supplies 20,000 Other 2,500
Daily Admissions 154,800 Annual Passes 156,180 Rentals 145,960 General Programs 44,460 Fitness 92,160 Sports 32,800 Merchandise for Sale 7,500 Special Events 5,000 Vending 4,000 Babysitting 21,750 Birtyhday Parties 45,000
AMENIT IES IN MET RO AREA
AMENIT IES IN BL O O MING T O N T
CO MMO N SPACES
CO MMO N SPACES
RECREAT IO N & FIT NESS
RECREAT IO N & FIT NESS
G YMNASIUM, O FFICES, SUPPO RT
G YMNASIUM, O FFICES, SUPPO RT
O PT IO N O NE: PUBL IC HEAL T H
O PT IO N O NE: PUBL IC HEAL T H
O PT IO N T WO & T HREE: AQ UAT ICS & MO T O R VEHICL E
O PT IO N T WO & T HREE: AQ UAT ICS & MO T O R VEHICL E
FUT URE EXT ERIO R SPACES
FUT URE EXT ERIO R SPACES
PRIO RIT IZED PRO G RAM
► Prioritie s re ma in true to g oa ls
► Ma inta in so c ia l/ re c re a tio na l o p p o rtunitie s a nd
e xp a nd fitne ss
► L
► G ymna siums ► Run/ Jo g / Wa lk T
► Multiuse c la ssro o ms
CO ST EST IMAT E
► 94,715 g ro ss sq ua re fe e t ► C o nstruc tio n C o sts
► Inc lud e s e sc a la tio n to 2016 ► $337/ sq ft
► So ft C o sts
► 30% a llo wa nc e
► T
NEXT ST EPS
NEXT ST EPS
T HANK YO U