Chapter 26 harmful organisms. Life is easier when we organize things - - PDF document

chapter 26
SMART_READER_LITE
LIVE PREVIEW

Chapter 26 harmful organisms. Life is easier when we organize things - - PDF document

2/11/2017 Why Classify? Classification has been around ever since people paid attention to organisms. One primeval system was based on harmful and non - Chapter 26 harmful organisms. Life is easier when we organize things into


slide-1
SLIDE 1

2/11/2017 1

Chapter 26 Phylogeny

Why Classify?

Classification has been around ever since people paid attention to organisms. One primeval system was based on “harmful” and “non- harmful” organisms. Life is easier when we organize things into groups.

History of Taxonomy

  • Biodiversity: variety of organisms at all levels

from populations to ecosystems.

  • Taxonomy: the science of classifying and

naming living organisms according to their morphological/physical characteristics and evolutionary history

  • Taxa: categories into which the organisms are

classified.

  • Phylogeny: evolutionary history of a species or

group of species according to their DNA

Systematics classifying organisms and determining their evolutionary relationships includes Taxonomy (classification) and Phylogenenetics (evolutionary history)

Taxonomy: Linnaean System

  • Binomial Nomenclature

(2 word naming system) Genus: category containing similar species (noun, capitalized) Species: single descriptive word (always lower case) Ex: Red oak: Quercus rubra Willow oak: Quercus phellos (common name) (scientific name)
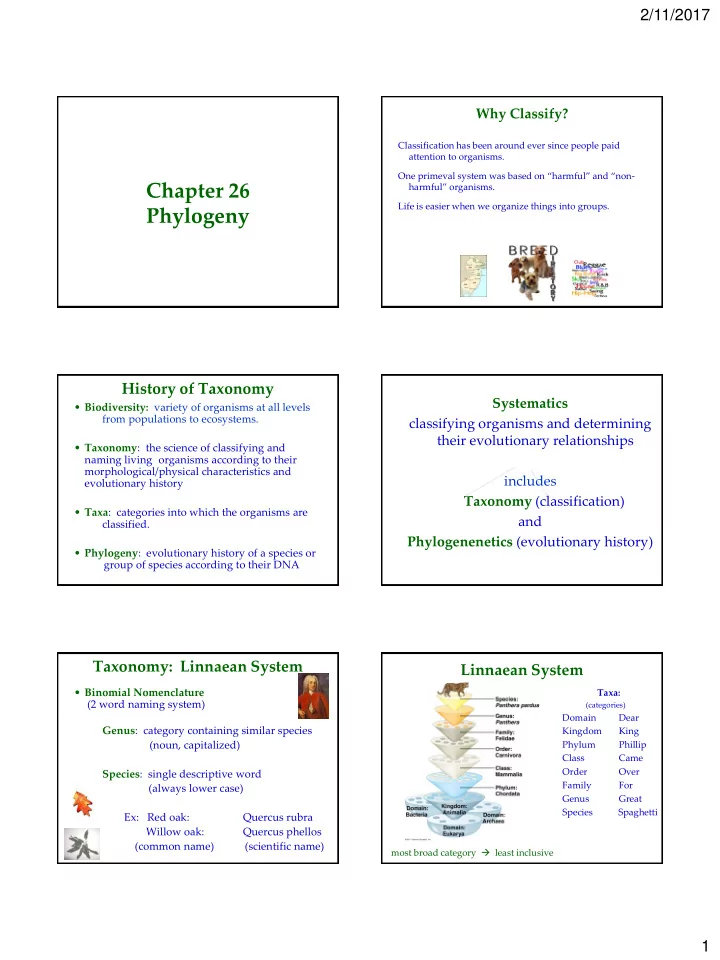
Linnaean System

most broad category  least inclusive Taxa:

(categories)

Domain Dear Kingdom King Phylum Phillip Class Came Order Over Family For Genus Great Species Spaghetti

slide-2
SLIDE 2

2/11/2017 2

Phylogenetics

  • Phylogenetics: analysis of the evolutionary

relationships among taxa (categories) based on:

  • fossil record
  • morphological (structural) similarities
  • embryological similarities
  • homologous features
  • molecular evidence (DNA, amino acids)

Phylogenetic Tree

Phylogenetic Tree

Branching diagram that shows evolutionary history of a group of

  • rganisms

(connection between classification and phylogeny) how to read a tree video how to understand an evolutionary tree video

Reading Phylogenetic Trees

  • like reading a family tree
  • root of the tree represents the ancestral lineage
  • tips of the branches represent the descendents of that

ancestor

  • as you move from the root to the tips, you are moving

forward in time.

Reading Phylogenetic Trees

  • Node: when a lineage splits (speciation), it is

represented as branching on a phylogeny

  • When a speciation event occurs, a single ancestral

lineage gives rise to two or more daughter lineages.

(node)

Reading Phylogenetic Trees

  • Phylogenies trace patterns of shared ancestry between

lineages.

  • Each lineage has a part of its history that is unique to it

alone and parts that are shared with other lineages.

Reading Phylogenetic Trees

  • Similarly, each lineage has ancestors that are

unique to that lineage and ancestors that are shared with other lineages — common ancestors

slide-3
SLIDE 3

2/11/2017 3

Reading Phylogenetic Trees

  • For any speciation event on a phylogeny, the

choice of which lineage goes to the right and which goes to the left is arbitrary.

  • The following phylogenies are equivalent:
  • Can be rotated at any node
  • r any combination of nodes

without changing the structure of the tree.

  • Leftmost tree shown in each row is identical from a phylogenetic

perspective to the trees shown to the right.

  • Colors indicate the nodes that were rotated in each case.

Reading Phylogenetic Trees

Evolution produces a pattern of relationships among lineages that is tree-like, not ladder-like. Just because we tend to read phylogenies from left to right, there is no correlation with level of "advancement."

Reading Phylogenetic Trees

Branch point 3 represents common ancestor of taxa A,B,and C The position of branch point 4 to the right of 3 indicates that taxa B and C diverged after their shared lineage split for taxon A. Sister taxa: share an immediate common ancestor Basal taxon: diverges early in history (outgroup)

1 2 3 4 5

(node) (relationships not clear) Branch lengths can represent time or genetic change Extant species: presently living

Reading Phylogenetic Trees

  • Misconceptions about humans
  • Humans did not evolve from

chimpanzees.

  • Humans and chimpanzees are

evolutionary cousins and share a recent common ancestor that was neither chimpanzee nor human.

  • Humans are not "higher" or "more

evolved" than other living lineages.

  • Since our lineages split, humans and

chimpanzees have each evolved traits unique to their own lineages.

Draw a phylogenetic tree based on the data below. Draw hatch marks on the tree to indicate the

  • rigin(s) of each of the 6 characters.
slide-4
SLIDE 4

2/11/2017 4

backbone hinged jaw four limbs amnion milk dorsal fin

What We Can and Can’t Learn from Phylogenetic Trees

  • Phylogenetic trees show patterns of descent.
  • Phylogenetic trees do not indicate when species evolved or

how much genetic changed occurred in a lineage.

  • It shouldn’t be assumed that a taxon evolved from the

taxon next to it.

  • Phylogeny provides important information about similar

characteristics in closely related species.

Cladistics

  • Developed by Hennig (German) in 1966

Cladistics: system of taxonomy based on common ancestry based on shared and derived characteristics

  • determines sequence that different groups
  • f organisms evolved
  • focuses on nature of characters (traits) in

different groups of organisms

  • Shared ancestral characters/traits:
  • evolved from common ancestor of both groups (taxa)
  • feature that evolved only within the group

ex: feathers in birds (evolved only in bird lineage, not inherited from ancestors that birds share with reptiles)

  • Shared derived character/traits:
  • set of unique characteristics found in specific

clade (common in all members of group)

  • evolved in an ancestor of one group but not the other

ex: hair in mammals

Cladograms

Cladogram: phylogenetic diagram that shows evolutionary relationships

  • Arranges organisms across

the top according to evolutionary history

  • Separates organisms by

characteristics

  • Shows organisms most

closely related to each other

Video (Bozeman) video 2 (Educreations)

Cladograms

  • Clade: evolutionary branch that includes common

ancestor and all descendents (living and extinct) of that ancestor.

  • Ingroup: species we are studying
  • Outgroup: species/group of species diverged before
  • ther lineages (least related)
slide-5
SLIDE 5

2/11/2017 5

  • Clades are nested within one another — they form a

nested hierarchy.

  • A clade may include many thousands of species or just a

few.

  • Some examples of clades at different levels are marked
  • n the phylogenies below.
  • Notice how clades are nested within larger clades.

Not all groupings qualify as Clades

“single tribe” ancestral species and all its descendants. true clade “beside the tribe” ancestral species and some of its descendants. “many tribes” includes various taxa that lack common ancestor

Constructing a Cladogram

Maximum parsimony: use simplest explanation for tree construction

  • DNA: fewest base changes
  • morphology: fewest evolutionary events

Phylogenetic bracketing predicts features of an ancestor from features of its descendants.

Constructing a Cladogram

  • Identify homologies shared characteristics derived from one ancestor.
  • The greater the number of homologous parts between two organisms,

the more closely related they are.

  • Similarities can be either:
  • Shared primitive characters:

homologous characters shared by more than one taxon ex: backbone is shared by mammals and reptiles

  • Shared derived characters,

characters unique for a particular clade. more derived characters = more evolutionarily unique

  • Analogous structures may look similar to one another, but are not

derived from a common ancestor (in contrast to homologous structures)

  • example of convergent evolution : independent development of

similarity between species due to similar selection pressures

Constructing a Cladogram

practice video 1. Select your species for which you want to make a cladogram. These are called the ingroup. 2. They have shared primitive and derived characters. 3. Select an outgroup  a species that is closely related to the species under study, the outgroup has a shared primitive character that is common to all species.

Constructing a Cladogram

  • 4. Construct a character table and tabulate the data.  The more shared

characters, the more closely related are the species.

  • 5. Construct a cladogram based on the number of shared characters. For

example: The outgroup here, the lancelet has a notochord, the shared primitive

  • character. The ingroup is five vertebrates

Minions practice video

slide-6
SLIDE 6

2/11/2017 6

Difference Between Phylogenetic Tree and Cladogram Both show hypothesized evolutionary relationships (phylogeny) between taxa.

PHYLOGENETIC TREE

  • Different branch lengths
  • Branch lengths are

proportional to the amount

  • f inferred evolutionary

change over time CLADOGRAM

  • Branches are of equal

length.

  • Show common ancestry,

but do not indicate the amount of evolutionary "time"

Modern Classification

Three Domains/Superkingdoms (1990’s)

  • Domain: taxonomic category above kingdom level