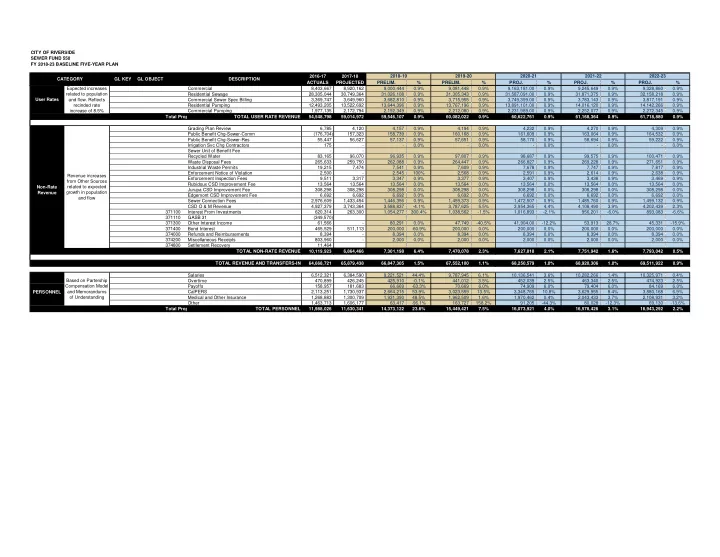

CITY OF RIVERSIDE SEWER FUND 550 FY 2018-23 BASELINE FIVE-YEAR PLAN 2016-17 2017-18 ACTUALS PROJECTED PRELIM. % PRELIM. % PROJ. % PROJ. % PROJ. % 2018-19 2019-20 2020-21 2021-22 2022-23 CATEGORY GL KEY GL OBJECT DESCRIPTION Commercial 8,403,667 8,920,162 9,000,444 0.9% 9,081,448 0.9% 9,163,181.00 0.9% 9,245,649 0.9% 9,328,860 0.9% Residential Sewage 28,305,044 30,749,364 31,026,108 0.9% 31,305,343 0.9% 31,587,091.00 0.9% 31,871,375 0.9% 32,158,218 0.9% Commercial Sewer Spec Billing 3,369,747 3,649,960 3,682,810 0.9% 3,715,955 0.9% 3,749,399.00 0.9% 3,783,143 0.9% 3,817,191 0.9% Residential Pumping 12,493,205 13,522,692 13,644,396 0.9% 13,767,196 0.9% 13,891,101.00 0.9% 14,016,120 0.9% 14,142,266 0.9% Commercial Pumping 1,977,135 2,172,794 2,192,349 0.9% 2,212,080 0.9% 2,231,989.00 0.9% 2,252,077 0.9% 2,272,345 0.9% Total Prop TOTAL USER RATE REVENUE 54,548,798 59,014,972 59,546,107 0.9% 60,082,022 0.9% 60,622,761 0.9% 61,168,364 0.9% 61,718,880 0.9% Grading Plan Review 6,785 4,120 4,157 0.9% 4,194 0.9% 4,232 0.9% 4,270 0.9% 4,309 0.9% Public Benefit Chg-Sewer-Comm (176,704) 157,323 158,739 0.9% 160,168 0.9% 161,609 0.9% 163,064 0.9% 164,532 0.9% Public Benefit Chg-Sewer-Res 55,447 56,627 57,137 0.9% 57,651 0.9% 58,170 0.9% 58,694 0.9% 59,222 0.9% Irrigation Svc Chg Contractors 175
- 0.0%
- 0.0%
- 0.0%
- 0.0%
- 0.0%
Sewer Unit of Benefit Fee
- Recycled Water
83,165 96,070 96,935 0.9% 97,807 0.9% 98,687 0.9% 99,575 0.9% 100,471 0.9% Waste Disposal Fees 265,633 259,750 262,088 0.9% 264,447 0.9% 266,827 0.9% 269,228 0.9% 271,651 0.9% Industrial Waste Permits 19,215 7,474 7,541 0.9% 7,609 0.9% 7,678 0.9% 7,747 0.9% 7,817 0.9% Enforcement Notice of Violation 2,500
- 2,545
100% 2,568 0.9% 2,591 0.9% 2,614 0.9% 2,638 0.9% Enforcement Inspection Fees 9,511 3,317 3,347 0.9% 3,377 0.9% 3,407 0.9% 3,438 0.9% 3,469 0.9% Rubidoux CSD Improvement Fee 13,564 13,564 13,564 0.0% 13,564 0.0% 13,564 0.0% 13,564 0.0% 13,564 0.0% Jurupa CSD Improvement Fee 308,298 308,298 308,298 0.0% 308,298 0.0% 308,298 0.0% 308,298 0.0% 308,298 0.0% Edgemont CSD Improvement Fee 6,692 6,692 6,692 0.0% 6,692 0.0% 6,692 0.0% 6,692 0.0% 6,692 0.0% Sewer Connection Fees 2,976,609 1,433,454 1,446,356 0.9% 1,459,373 0.9% 1,472,507 0.9% 1,485,760 0.9% 1,499,132 0.9% CSD O & M Revenue 4,927,379 3,743,364 3,588,837
- 4.1%
3,787,625 5.5% 3,954,365 4.4% 4,108,490 3.9% 4,202,439 2.3% 371100 Interest From Investments 620,314 263,300 1,054,277 300.4% 1,038,562
- 1.5%
1,016,893
- 2.1%
956,201
- 6.0%
893,083
- 6.6%
371110 GASB 31 (349,570) 371300 Other Interest Income 61,566
- 80,291
0.0% 47,749
- 40.5%
41,904.00
- 12.2%
53,913 28.7% 45,331
- 15.9%
371400 Bond Interest 465,529 511,113 200,000
- 60.9%
200,000 0.0% 200,000 0.0% 200,000 0.0% 200,000 0.0% 374000 Refunds and Reimbursements 8,394
- 8,394
0.0% 8,394 0.0% 8,394 0.0% 8,394 0.0% 8,394 0.0% 374200 Miscellaneous Receipts 803,960
- 2,000
0.0% 2,000 0.0% 2,000 0.0% 2,000 0.0% 2,000 0.0% 374800 Setllement Recovery 11,464 TOTAL NON-RATE REVENUE 10,119,923 6,864,466 7,301,198 6.4% 7,470,078 2.3% 7,627,818 2.1% 7,751,942 1.6% 7,793,042 0.5% TOTAL REVENUE AND TRANSFERS-IN 64,668,721 65,879,438 66,847,305 1.5% 67,552,100 1.1% 68,250,579 1.0% 68,920,306 1.0% 69,511,922 0.9% Salaries 6,512,321 6,384,590 9,221,521 44.4% 9,787,945 6.1% 10,136,541 3.6% 10,282,266 1.4% 10,325,971 0.4% Overtime 470,899 426,245 425,910
- 0.1%
441,012 3.5% 452,039 2.5% 463,340 2.5% 474,923 2.5% Payoffs 158,957 181,683 66,669
- 63.3%
70,669 6.0% 74,909 6.0% 79,404 6.0% 84,169 6.0% CalPERS 2,113,251 1,730,937 2,664,215 53.9% 3,023,559 13.5% 3,348,765 10.8% 3,629,955 8.4% 3,880,168 6.9% Medical and Other Insurance 1,268,883 1,300,709 1,931,390 48.5% 1,962,509 1.6% 1,970,462 0.4% 2,043,433 3.7% 2,108,931 3.2% Other 1,463,713 1,606,177 63,417
- 96.1%
163,727 158.2% 91,205
- 44.3%
80,028
- 12.3%
69,130
- 13.6%
Total Prop TOTAL PERSONNEL 11,988,026 11,630,341 14,373,122 23.6% 15,449,421 7.5% 16,073,921 4.0% 16,578,426 3.1% 16,943,292 2.2% User Rates Expected increases related to population and flow. Reflects recinded rate increase of 8.5% Non-Rate Revenue Revenue increases from Other Sources related to expected growth in population and flow PERSONNEL Based on Partership Compensation Model and Memorandums
- f Understanding