COI/Disclosures Predictive Analytics: Making Adult Chris Ames, MD - - PDF document

coi disclosures predictive analytics making adult
SMART_READER_LITE
LIVE PREVIEW

COI/Disclosures Predictive Analytics: Making Adult Chris Ames, MD - - PDF document

COI/Disclosures Predictive Analytics: Making Adult Chris Ames, MD has financial interests to disclose. Spinal Deformity Surgery Sustainable Royalty: Biomet Zimmer, Stryker, Depuy Synthes, Christopher P Ames MD K2M, Next Spine, Medicrea,


slide-1
SLIDE 1

Predictive Analytics: Making Adult Spinal Deformity Surgery Sustainable

Christopher P Ames MD

Professor of Neurosurgery and Orthopaedic Surgery Director of Spinal Deformity and Spinal Tumor Surgery

University of California San Francisco Benzel AANS 2019

COI/Disclosures

 Chris Ames, MD has financial interests to

disclose.

 Royalty: Biomet Zimmer, Stryker, Depuy Synthes,

K2M, Next Spine, Medicrea, Astura

 Consulting: Medtronic, Biomet Zimmer,

Depuy Synthes, K2M, Medicrea

 Research: Titan Spine, Depuy Synthes ISSG  Editorial Board: Operative Neurosurgery  Grant Funding: SRS  Executive Committee: ISSG

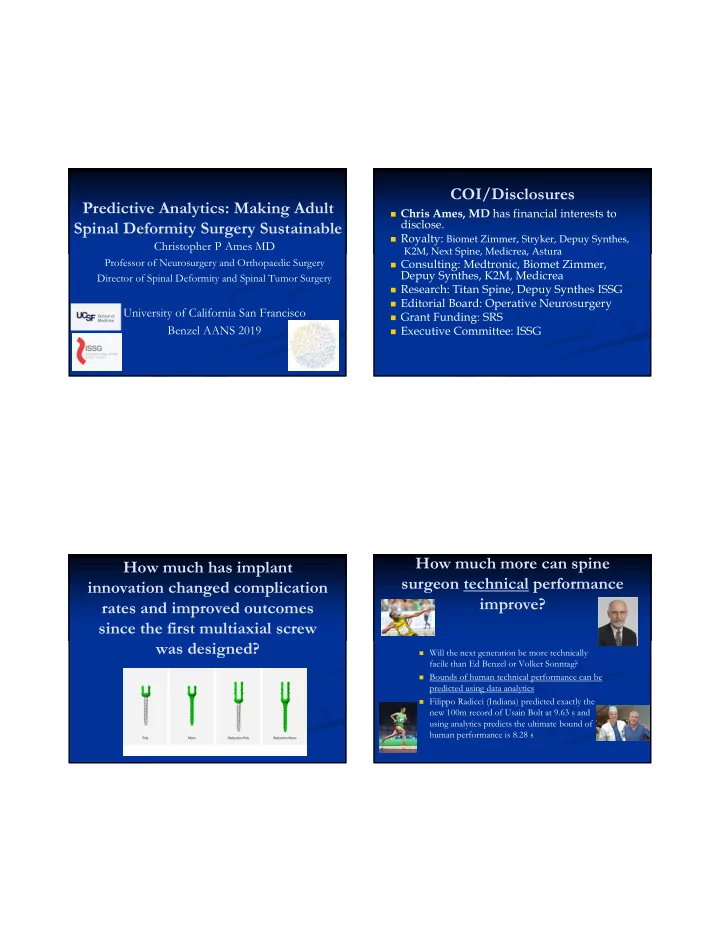
How much has implant innovation changed complication rates and improved outcomes since the first multiaxial screw was designed? How much more can spine surgeon technical performance improve?

 Will the next generation be more technically

facile than Ed Benzel or Volker Sonntag?

 Bounds of human technical performance can be

predicted using data analytics

 Filippo Radicci (Indiana) predicted exactly the

new 100m record of Usain Bolt at 9.63 s and using analytics predicts the ultimate bound of human performance is 8.28 s

slide-2
SLIDE 2

Why is disruptive technology needed now?

 53 million people over age 65 now and

increasing

 80 million over 65 by 2050  60% prevalence of spinal deformity (cobb

greater than 10 degrees)

 32 million people with ASD in US

Economic Burden of Aging Musculoskeletal System

 Total Health care cost

3.5 trillion 2017

 Musculoskeletal

disease cost >800 billion/year

Spinal

Deformity $80 billion (2011)

Number of USA ASD Procedures increased by 157% in 10 years

50,000 100,000 150,000 200,000 250,000 1999 2000 2001 2002 2003 2004 2005 2006 2007 2008 2009

Number of discharges with at least one diagnosis of spinal curvature' (ICD‐9 code 737.0 to 737.9)

Children Adult

Healthcare Costs and Utilization Project (HCUP http://hcupnet.ahrq.gov),

slide-3
SLIDE 3

Do not go gentle …

Modern expectations of high function in old age

Complexity Increasing Utilization of wedge osteotomies

200 300 400 500 600 700 800 2003 2004 2005 2006 2007 2008 2009 2010

# Wedge Osteotomies (77.29 ICD‐9‐CM)

0% 10% 20% 30% 40% 50% 60% 70% 80% 90% 100% 2003 2004 2005 2006 2007 2008 2009 2010

Wedge Osteotomies by age group

>65 45‐64 18‐44

Increases on 275% in less than 10 years ~250 procedures in 2003 ~700 procedures in 2012 Increase proportion of patients >65yo ~20% in 2003 ~40% in 2012

Surgery improves disability

Disease State PCS; mean NBS points MCS; mean NBS points US Total Population 50 49.9 US Healthy Population 55.4 52.9 ASD 40.9 49.4 Back Pain 45.7 47.6 Cancer 40.9 47.6 Depression 45.4 36.3 Diabetes 41.1 47.8 Heart Disease 38.9 48.3 Hypertension 44.0 49.7 Limited Use Arms Legs 39.0 43.0 Lung Disease 38.3 45.6

Spine J 2014

slide-4
SLIDE 4

Failures destroy cost effectiveness

Failure Prevention

 Double pelvis  Double rods  VCR rod  BMP-2  Ligament repair  Vertebroplasty  2 surgeons  Plastic Surgery

 Eliminates provider variability  Appropriateness criteria for all surgeons  Transparency  Multidisciplinary  Best practices  3 fold improvement in the worst complications  12 fold decrease in return to surgery in the first three months postop

slide-5
SLIDE 5

Collective Intelligence

 The 56 person group

average better than any individual and came within 3% of total

 Only 1 individual

“guessed” better

Eliminates

  • utliers

Reduce Complications by Limiting Care

 Of course we decrease complications by

  • perating on more robust patients

 But, patients who experience major

complications still do well

 Most disabled patients with high frailty scores

improve the most

Approved: Low risk

High Risk but Good Outcome

Older had Greater improvement after PSO in general health Big Data-Datify the Patient

“Painting true picture of patient with many data points”

slide-6
SLIDE 6

FICO Score….Preop Risk Score? Results

25% 44% 62% 0% 10% 20% 30% 40% 50% 60% 70% Not Frail Pre-Frail Frail

Major Complication Incidence

Pearson Chi2 = 29.7 Pr = 0.000

Frailty is a Predictive ROS

1) Bladder incontinence ☐ Yes ☐ No 2) Bowel incontinence ☐ Yes ☐ No 3) Leg weakness ☐ Yes ☐ No 4) Loss of Balance ☐ Yes ☐ No 5) Do you currently smoke? ☐ Yes ☐ No 6) Are you currently on disability? ☐ Yes ☐ No 7) Current height and weight (BMI) ☐ <18.5 ☐ 18.5-30 ☐ >30 8-18) Medical History (check all that apply): ☐ Cancer ☐ Heart Disease ☐ Diabetes ☐ Hypertension ☐ Liver disease ☐ Lung disease ☐ Kidney disease ☐ Osteoporosis ☐ Peripheral vascular disease ☐ Prior DVT/PE/Stroke (blood clot) ☐ Greater than 3 medical problems 19) Would you say your current health is: ☐ the same or better than last year ☐ worse than this time last year 20) Would you say your current health is: ☐ Excellent or Good ☐ Fair or Poor How much difficulty do you have with each of the following activities: 21) Climbing 1 flight of stairs ☐ Moderate/Little/No difficulty ☐ Extreme difficulty/Require assistance or assistive device/Unable to do 22) Driving a car ☐ Moderate/Little/No difficulty ☐ Extreme difficulty/Require assistance or assistive device/Unable to do 23) Getting dressed ☐ Moderate/Little/No difficulty ☐ Extreme difficulty/Require assistance or assistive device/Unable to do 24) Getting in and out of bed ☐ Moderate/Little/No difficulty ☐ Extreme difficulty/Require assistance or assistive device/Unable to do 25) Walking 100 yards ☐ Moderate/Little/No difficulty ☐ Extreme difficulty/Require assistance or assistive device/Unable to do 26) Get around the house without an assistive device ☐ Moderate/Little/No difficulty ☐ Extreme difficulty/Require assistance or assistive device/Unable to do 27) Performing light activity (vacuuming, playing golf) ☐ Moderate/Little/No difficulty ☐ Extreme difficulty/Require assistance or assistive device/Unable to do 28) Bathing yourself ☐ Moderate/Little/No difficulty ☐ Extreme difficulty/Require assistance or assistive device/Unable to do 29) Normal work or schoolwork or housework ☐ Moderate/Little/No difficulty ☐ Extreme difficulty/Require assistance or assistive device/Unable to do 30) Lift medium weight objects ☐ Moderate/Little/No difficulty ☐ Extreme difficulty/Require assistance or assistive device/Unable to do 31) Travel more than 1 hour ☐ Moderate/Little/No difficulty ☐ Extreme difficulty/Require assistance or assistive device/Unable t 32) Perform all personal care ☐ Moderate/Little/No difficulty ☐ Extreme difficulty/Require assistance or assistive device/Unable t How often in the last month have you experienced the following: 33) Feeling downhearted and depressed ☐ All or most of the time ☐ Some, little or none of the time 34) Feeling so down in the dumps you cannot cheer up no matter what you ☐ All or most of the time ☐ Some, little or none of the time 35) Feeling tired/exhausted ☐ All or most of the time ☐ Some, little or none of the time 36) Feeling worn out/used up ☐ All or most of the time ☐ Some, little or none of the time 37) Difficulty remembering things you used to have no trouble with ☐ All or most of the time ☐ Some, little or none of the time 38) Feeling like your thinking is slow or clouded ☐ All or most of the time ☐ Some, little or none of the time 39) What is your current level of activity? ☐ Bedridden or primarily no activity ☐ Light to full sports/activities 40) How is your social life? ☐ My social life is restricted to my home or non-existent ☐ My social life is normal or mildly restricted

slide-7
SLIDE 7

Research to Implementation Spine Frailty is now in UCSF EHR Augmented Intelligence EHR work flows

Datify the Procedure….

Mirza ASD-S ASD-R R2 EBL 0.22 0.28 0.34 p value EBL 0.0012 <0.001 <0.001 R2 Op time 0.18 0.26 0.34 p value OP time 0.007 0.0002 < 0.0001

Neurosurgery 2017

Ok for RISK but ….What drives OUTCOMES?

 Previous work has

sought answers in correlations

 Outcome driven by

alignment

 But what does the new

Information Age and AI tell us??

 There is much more

slide-8
SLIDE 8

Baseline SVA vs ODI

 All pts, op and nonop, n=1622

R2 = .19

2yr SVA fused to Pelvis vs ODI

 All 2yr follow up Op pts, n= 502 R2 = .04

Predictive Analytics

Pt Apical Fusion T10-pelvis T3-pelvis PSO Frailty +

All data fields analyzed separately

25% MCID pain 10% MCID appearance 50% revision 5% medical complication 90% play tennis 60% MCID pain 80% MCID appearance 10% revision 25% major complication 5% play tennis Complication Avoidance

First Generation Models-Q/O

 3 successful binary output models constructed

 Proximal junctional kyphosis/failure *Spine 2016  Major intra/periop complications *JNS Spine 2017  Oswestry Disability Index (ODI) minimal clinical

important difference *Spine Deformity 2018

 Methods  5 different bootstrapped decision trees  Internal validation 70:30 data split for

training/testing

 Accuracy, and the area under a receiver operator

characteristic (ROC) calculated

slide-9
SLIDE 9

Second generation models-Q/V

 Pseudoarthrosis (with/without biologics as

modifiable variable) 91% accuracy

 LOS model –first attempt at a continuous

  • utput model (from yes/no to 3,4, 5,6 days etc)

75% accuracy

 Cost effectiveness model: what if we used our

MCID model for patient selection ?

  • World Neurosurgery 2018
  • Clinical Spine Surgery 2018
  • Neurosurgical Focus 2018

Results: QALY

 Surgical Decisions according to model vs

Surgical Decisions by Surgeon – Simulation

 Greater Qaly Gain using model

2019 : Results in Combined Dataset patients from 17 hospitals

 ISSG and ESSG Data  Time frame: 2008-2015  >1600 patients  > 2000 patient years  17 sites, 11 US, 2 Spain, 2 Turkey, 1 France and 1

Switzerland

 35 surgeons  R (Miquel Serra PhD)  Kernel Analytics for Web Deployment and Machine

Learning

slide-10
SLIDE 10

Complications, Reop, Readmission Accepted JNS Spine 2019

 Individual informed

consent

 Individual cumulative risk

estimates for MC at 2y ranged from 3.9%-74.1%

 Surgical invasiveness (LIV-

pelvic fixation, length of fusion, prior surgery), age, sagittal deformity, patient frailty (walking and lifting capacity) and blood loss most strongly predict MC

* Pellise et al ISSG ESSG analytics collaboration SRS 2019 submitted

Dynamics of Complications Prediction

Before Surgery After Surgery Blood & Time Discharge Patient Characteristics Surgery Characteristics Hospital Surgeon 64% 70% 73% 65% 71% 75% 79% 74% 70% 80% 79% 76%

Identify pts at risk Of bounce back

** predictive analytics-driven interventions directed at high-risk individuals reduced emergency room and specialist visits

Major Complication Risk Calculator 2018v1

 Patient-related factors, >1/3 of which are

potentially modifiable, account for 55% of the predictive model weight.

 Surgeon and site represent 4-10% for MC, but

are most relevant for READMIT and UNPLAN

slide-11
SLIDE 11

Baseline & outcome heterogeneity, n=2,207, 4078.57 observation-years

Outcomes—Are YOU average?

* Only 5% of patients had “average improvement”

Can we Predict Outcome?

 75 variables were used in the training of the models

including demographic data, comorbidities, frailty, modifiable surgical variables, baseline health-related quality of life, coronal and sagittal radiographic parameters, hospital and surgeon

 8 different prediction algorithms were trained with 3-

time horizons, baseline-1year, baseline-2years and 1year-2years

 SRS 22R, DOMAINS AND TOTAL, ODI, SF-

36 PCS and MCS * Spine 2019

Top Outcome Predictors:

 Up to 82.5 % predictive

power

 Preop scores most

important

 Surgeon and Site 1.8%

  • f variation

Calculator Output SRS 22

slide-12
SLIDE 12

BUT, Patients don’t want to know how their SRS Total will improve!

 Will I walk better?  Will I be able to return to work?  Will my pain improve?  Will my mood improve?  Will I feel better about how I look?  Will I really be satisfied with surgical

treatment?

Individual SRS 22 responses with wait for surgery simulations

75-85% Predictive Power

The Age of Artificial Intelligence Driven Decision Support

 Every patient is different and

represents a unique combination of frailty, disability, mental health …

 Every surgeon is different and

every surgery plan is unique ….

How the Machine sees it

HOW THE SURGEON SEES IT

Frailty= .5 ODI 42 CCI 4 ASA 3 BMI 25 BMD -1.5 Cc: low back pain Med: norco

SVA 12cm PI-LL 28 PT 35 TK 55 CSVA 0

>100 variables

slide-13
SLIDE 13

A.I. Nearest Neighbor Recall Clusters and R/B

Spine 2019

New AI driven ASD Classification

 Outcome and Complications  Based on Clustering of Surgical Types and

Patient Types

 Rather than a classification based on R2 to one

parameter class which varies by age

Results: Outcomes Grid

52

slide-14
SLIDE 14

Results: Efficiency Plots

Preop Risk vs Benefit Plotting

53

Preoperative Prediction of Cost and Catastrophic Cost in Adult Spine Deformity Surgery: Feasibility Analysis of Predictive Analytics to Establish 90 day bundled payments

 Models Predicted 90 day dollar

cost with 70.1 % accuracy

 Out of the total variance

explained, 22.63% was only explained by site and surgeon fixed-effects

 The top 4 predictors of cost by

  • rder were; surgeon, number of

levels fused, IBF, site

 CC > $ 100,000 was predicted

preoperatively with a 90.41% accuracy

Predicting ASD Surgeries That Exceed Medicare Allowable Payment Thresholds

 AUC 94.48%)  56.8% increased

likelihood getting reimbursed more than the cost of surgery (iEOC<MA) if done at an academic center.

SRS 2019

Where is ASD? & the ladder

56

The Ladder of Causation – J. Pearl

ASD surgery, PubMed literature 1950-2018, n=6,621 articles

slide-15
SLIDE 15

Clustering of patients v2 – “Young coronal” vs “worst patients”

n=193 16% 27.55

  • 6.64

1.69 48.82 17.26 3.47 44.96 47.14 n=118 47% 65.57 140.49 71.24 38.42 57.27 2.39 43.25 25.31

Clinical Trials

N=729 N=35

Clustering of patients – Effect size & Power for trials Pseudoarthrosis Trends ISSG— Average or Benchmarking

THANK YOU !!!