
SLIDE 1
32
Completion Outcomes Degree/Transfer 32 Momentum Points Persistence - - PowerPoint PPT Presentation
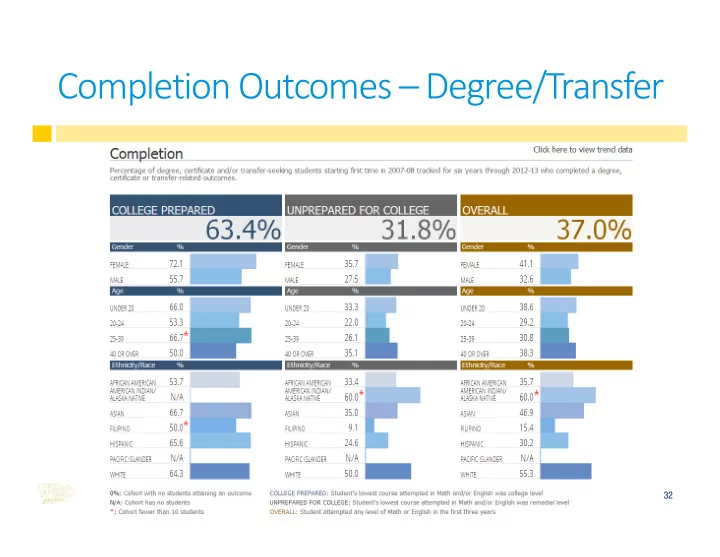
Completion Outcomes Degree/Transfer 32 Momentum Points Persistence 33 Momentum Points 30 Units 34 Momentum Points Remedial 35 Completion Outcomes CTE 36 California Community Colleges Chancellor's Office 2014 Score Card
32
33
34
35
36
California Community Colleges Chancellor's Office 2014 Score Card Metric Summary Report: Completion (SPAR) by Rank of Percent of Student Who Are Unprepared
Cohort Year 2007-2008 (Outcomes by 2012-2013) Completion Rank Percent of Unprepared* % Unprepared Rank Rank Difference Cohort Year 2007-2008 (Outcomes by 2012-2013) Completion Rank Percent of Unprepared* % Unprepared Rank Rank Difference Moorpark 61.03% 7 39.72% 1
Sacramento City 51.65% 28 76.13% 57 29 Santa Barbara 62.35% 5 47.48% 2
Sequoias 42.84% 79 76.80% 58
MiraCosta 55.89% 16 51.43% 3
Cosumnes River 46.92% 53 76.86% 59 6 Orange Coast 61.53% 6 53.30% 4
Lake Tahoe 46.08% 58 76.96% 60 2 Saddleback 57.04% 13 55.24% 5
Skyline 47.68% 48 77.02% 61 13 Foothill 64.27% 2 56.69% 6 4 Folsom Lake 47.18% 50 77.18% 62 12 Irvine 62.74% 4 57.91% 7 3 Siskiyous 42.97% 78 77.19% 63
Ventura 54.29% 19 59.07% 8
Butte 44.92% 65 77.22% 64
Glendale 54.24% 21 59.53% 9
Cypress 46.74% 54 77.26% 65 11 Santiago Canyon 55.74% 17 59.57% 10
Canyons 58.57% 9 77.27% 66 57 Coastline 52.76% 23 60.82% 11
Monterey 51.97% 27 77.88% 67 40 West Valley 56.77% 14 61.09% 12
Chabot Hayward 49.10% 41 78.25% 68 27 Feather River 49.17% 39 61.16% 13
Oxnard 43.63% 68 78.37% 69 1 Sierra 49.10% 40 63.01% 14
Reedley College 45.95% 60 78.73% 70 10 Allan Hancock 45.33% 62 63.03% 15
Mt San Antonio 47.13% 51 78.90% 71 20 San Diego Mesa 60.97% 8 64.38% 16 8 Lassen 38.31% 98 79.03% 72
Diablo Valley 58.55% 10 64.91% 17 7 Antelope Valley 43.52% 70 79.50% 73 3 Shasta 39.16% 96 66.49% 18
Fresno City 41.69% 87 79.63% 74
Santa Rosa 54.40% 18 66.58% 19 1
LA Valley 42.27% 85 80.11% 75 ‐10
Evergreen Valley 50.52% 34 66.83% 20
Modesto 42.43% 84 80.55% 76
Pasadena 52.53% 24 67.83% 21
Los Medanos 43.11% 74 81.01% 77 3 Deanza 66.91% 1 68.09% 22 21 West Hills Coalinga 44.99% 64 81.12% 78 14 Columbia 44.32% 66 68.21% 23
Citrus 46.38% 56 81.26% 79 23 Berkeley City 46.55% 55 68.32% 24
Yuba 39.90% 91 81.29% 80
Cabrillo 48.78% 43 68.41% 25
LA Pierce 50.68% 32 81.53% 81 49
Mission 48.54% 44 68.83% 26
LA Harbor 39.94% 89 81.61% 82 ‐7
Gavilan 43.01% 76 68.96% 27
Grossmont 50.44% 35 81.70% 83 48 Napa 51.04% 31 69.10% 28
Porterville 45.23% 63 83.02% 84 21 Golden West 52.09% 26 69.17% 29 3 Mendocino 38.00% 99 83.11% 85
Solano 45.76% 61 69.90% 30
Merced 37.25% 101 83.29% 86
Santa Monica
47.71% 47 70.03% 31
Imperial 43.58% 69 83.47% 87 18 San Diego Miramar 53.56% 22 70.06% 32 10
West LA 37.01% 102 83.56% 88 ‐14
Las Positas 57.83% 12 70.18% 33 21 Chaffey 42.71% 80 83.66% 89 9 Contra Costa 46.93% 52 70.35% 34
Cuyamaca 47.51% 49 83.72% 90 41 Ohlone 58.44% 11 70.36% 35 24 Bakersfield 39.94% 90 84.04% 91 1 Canada 49.20% 38 70.48% 36
42.46% 83 84.08% 92 9 Cuesta 51.26% 30 70.74% 37 7 Rio Hondo 37.89% 100 85.45% 93
Laney 48.93% 42 71.13% 38
Riverside 39.71% 93 85.64% 94 1 Redwoods 43.00% 77 71.25% 39
Taft 34.43% 103 86.18% 95
Santa Ana 46.04% 59 71.62% 40
San Francisco 55.98% 15 86.89% 96 81 San Jose City 44.28% 67 71.71% 41
Desert 38.43% 97 87.32% 97 Alameda 51.51% 29 71.90% 42 13 Barstow 43.15% 73 87.56% 98 25
El Camino
48.22% 45 72.22% 43
East LA 41.75% 86 87.83% 99 13
Palomar 50.63% 33 72.23% 44 11 Hartnell 43.32% 72 88.05% 100 28 San Mateo 52.50% 25 72.54% 45 20
LA City 39.40% 95 88.65% 101 6
American River 43.08% 75 72.63% 46
Long Beach 42.67% 81 88.78% 102 21 Cerro Coso 49.78% 37 72.71% 47 10 Cerritos 41.30% 88 89.19% 103 15 Merritt 46.15% 57 73.08% 48
Palo Verde 30.63% 109 90.09% 104
San Diego City 63.67% 3 73.29% 49 46
Compton
31.21% 107 90.20% 105
San Joaquin Delta 47.72% 46 73.92% 50 4
LA Trade 32.76% 106 91.01% 106
Fullerton 49.85% 36 74.26% 51 15 Victor Valley 39.70% 94 91.22% 107 13 Southwestern 43.52% 71 75.05% 52
San Bernardino 33.47% 104 91.68% 108 4 Marin 54.26% 20 75.47% 53 33
LA Mission 33.26% 105 91.71% 109 4
Copper Mountain 26.80% 110 75.69% 54
LA Swest 31.19% 108 93.32% 110 2
West Hills Lemoore 42.54% 82 75.71% 55
Crafton Hills 39.81% 92 75.91% 56
*
(OC% - PC%) / (UC%-PC%)