
SLIDE 1
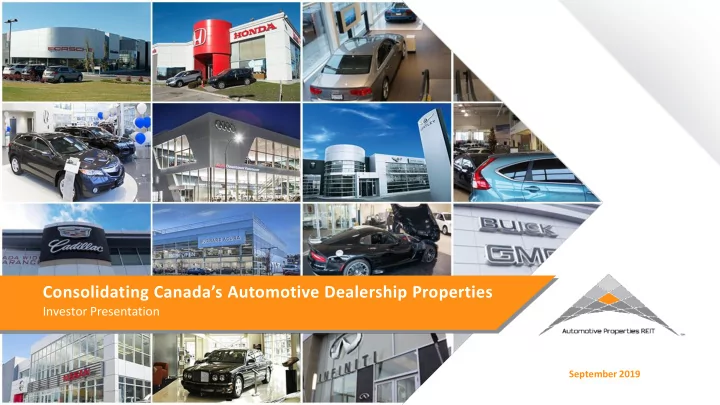
September 2019
Consolidating Canada’s Automotive Dealership Properties
Investor Presentation
Consolidating Canadas Automotive Dealership Properties Investor - - PowerPoint PPT Presentation
Consolidating Canadas Automotive Dealership Properties Investor Presentation September 2019 Disclaimer FORWARD-LOOKING STATEMENTS Certain statements contained in this presentation constitute forward-looking information within the meaning of
September 2019
Investor Presentation
FORWARD-LOOKING STATEMENTS Certain statements contained in this presentation constitute forward-looking information within the meaning of applicable securities legislation. Forward-looking information may relate to the REIT’s future
and objectives of or involving the REIT. Particularly, statements regarding future results, performance, achievements, prospects or opportunities for the REIT or the real estate or automotive dealership industry are forward-looking statements. The REIT has based these forward-looking statements on factors and assumptions about future events and financial trends that it believes may affect its financial condition, results of operations, business strategy and financial needs, including that the Canadian economy will remain stable over the next 12 months, that tax laws remain unchanged, that conditions within the automotive dealership real estate industry and the automotive dealership industry generally, including competition for acquisitions, will be consistent with the current climate, that the Canadian capital markets will provide the REIT with access to equity and/or debt at reasonable rates when required and that the Dilawri Organization will continue its involvement with the REIT. Although the forward-looking statements contained in this presentation are based upon assumptions that management believes are reasonable based on information currently available to management, there can be no assurance that actual results will be consistent with these forward-looking statements. Forward-looking statements necessarily involve known and unknown risks and uncertainties, many of which are beyond the REIT’s control, that may cause the REIT’s or the industry’s actual results, performance, achievements, prospects and opportunities in future periods to differ materially from those expressed or implied by such forward-looking statements. The forward-looking statements made in this presentation relate only to events or information as of the date of this presentation. Except as required by law, the REIT and Dilawri undertake no obligation to update or revise publicly any forward-looking statements, whether as a result of new information, future events or otherwise, after the date on which the statements are made or to reflect the occurrence of unanticipated events. Please refer to “Forward-Looking Statements” in the REIT’s regulatory filings. NON-IFRS MEASURES This presentation makes reference to certain non-IFRS measures. Funds from operations (‘‘FFO’’), adjusted funds from operations (‘‘AFFO’’), net operating income (‘‘NOI’’), cash net operating income (‘‘Cash NOI’’) and Same Property cash operating income (“Same Property Cash NOI”) are key measures of performance used by management and real estate businesses. However, such measures are not defined by IFRS and do not have standardized meanings prescribed by IFRS. The REIT believes that AFFO is a key measure of economic earnings performance and is indicative of the REIT’s ability to pay distributions from earnings, while FFO, NOI and Cash NOI are important measures of operating performance and the performance of real estate properties. The IFRS measurement most directly comparable to FFO, AFFO, NOI and Cash NOI is net income. Please refer to “Non-IFRS Measures” in the REIT’s regulatory filings.
1
CANADA’S ONLY PUBLIC VEHICLE CONSOLIDATING AUTOMOTIVE DEALERSHIP PROPERTIES
Long-term, triple-net leases with contractual annual rent escalators Representing 32 global manufacturers / brands
exposure to VECTOM markets
urban real estate 2
Greater Vancouver Area Edmonton Calgary Regina Greater Toronto Area Ottawa / Kingston Greater Montreal Area Winnipeg Kitchener-Waterloo / Guelph
square feet of Gross Leasable Area (“GLA”) income-producing properties Tesla
3
Recent price: $10.35¹ Market capitalization:
Annualized distribution
Analyst coverage
Yield¹
Q2 2019 AFFO Payout Ratio
2018 tax treatment
Investment properties:
3-year total return: 27%2 REIT Units: 29.8 million1 Class B Units: 9.93 million
(1) As at August 28, 2019 (2) As at June 30, 2019
200,000 400,000 600,000 800,000 1,000,000
QC ON MB SK AB BC & Territories 2017 2018
65 70 74 78 83 83 83 87 92 96 94 88 96 100 105 113 122 132 146 160 162
1998 1999 2000 2001 2002 2003 2004 2005 2006 2007 2008 2009 2010 2011 2012 2013 2014 2015 2016 2017 2018
THE AUTOMOTIVE RETAIL SALES INDUSTRY IS CANADA’S LARGEST RETAIL SEGMENT
($billions)
Retail Sales Auto industry’s proportion of Canada’s overall retail sales of products and merchandise in 2018
Canadian New Motor Vehicle Sales (# of units sold, 2018 and 2017)
Annual unit sales in Canadian history (slight ~2% decline from record levels in 2017)
Motor vehicle unit sales in Canada in 2018
(1) Source: Statistics Canada
4
80.7% OF PROFITS ARE GENERATED FROM REVENUE SOURCES OTHER THAN NEW CAR SALES
5
Parts, service and repair Finance and Insurance New vehicle sales Used vehicle sales
Average revenue / profit % contribution per business segment for major North American automotive dealership groups¹
(1) Chart data is derived from the public disclosure of Auto Canada, Lithia, Penske Automotive, AutoNation, Group 1 Automotive, Ashbury Automotive and Sonic Automotive for the six months ended June 30, 2019
10% 20% 30% 40% 50% Percentage of total profit (average) Percentage of total revenue (average)
US PUBLIC DEALERSHIP COMPANIES UP 51% YTD AS PROFITS REMAIN RESILIENT
7
Source: RBC Capital Markets as at July 7, 2019
Price Dividend Market Cap EV P/E EV/EBITDA Gain Net Debt/EBITDA Company Ticker 8-6-19 Yield (USD MM) (USD MM) 2017 2018 2019E 2020E 2017 2018 2019E 2020E Revenue EBITDA EPS YTD MRQ/2019E Asbury Automotive ABG-US 92.85 0.2% 1,792 2,692 14.0x 11.0x 10.0x 9.6x 8.3x 8.5x 8.0x 7.8x 4.1% 2.0% 13.7% 39.3% 2.7x AutoNation AN-US 47.81 1.4% 4,312 6,701 10.8x 10.7x 10.7x 10.4x 7.2x 7.1x 6.8x 7.2x
0.3% 1.1% 33.9% 2.4x Group 1 Automotive GPI-US 82.55 1.3% 1,480 2,810 8.2x 9.3x 8.1x 7.8x 6.5x 7.3x 7.0x 6.7x 2.0%
1.7% 56.6% 3.3x Lithia Motors LAD-US 128.77 0.9% 3,026 4,331 13.2x 12.9x 11.5x 10.6x 9.0x 9.5x 8.8x 8.3x 8.5% 2.5% 7.7% 68.7% 2.7x Penske Automotive PAG-US 44.87 3.2% 3,720 5,924 6.3x 8.4x 8.5x 8.0x 8.4x 7.1x 7.4x 7.1x 3.6% 5.7%
11.3% 2.7x Sonic Automotive SAH-US 27.03 0.9% 1,169 2,081 12.9x 14.9x 12.0x 11.5x 6.7x 7.8x 6.9x 6.8x 1.9%
4.0% 96.4% 3.0x Peer Average 1.3% 2,583 4,090 10.9x 11.2x 10.1x 9.6x 7.7x 7.9x 7.5x 7.3x 3.2% 1.5% 3.4% 51.0% 2.8x AutoCanada ACQ-CA 8.60 4.7% 177 400 4.1x 215.0x 17.8x 6.1x 4.7x 9.0x 5.6x 4.3x 4.0% 2.9%
2.9x CAGR 2017 - 2020E
7
and one expansion, adding ~ 800,000 sq. ft of GLA, for a combined purchase price of approximately $262 million
Winnipeg and Kitchener-Waterloo / Guelph
representation of new automotive brands – Subaru, Lexus and Tesla
CONTINUED GEOGRAPHIC, BRAND AND TENANT DIVERSIFICATION
portfolio
fully-subscribed equity offerings totaling ~$225.5 million
diversification
900,000 1,100,000 1,300,000 1,500,000 1,700,000 1,900,000 2,100,000 2,300,000 25 30 35 40 45 50 55 60 65 Q3 Q4 Q1 Q2 Q3 Q4 Q1 Q2 Q3 Q4 Q1 Q2 Q3 Q4 Q1 Q2 2015 2016 2017 2018 2019
Gross Leasable Area (square feet) Number of Properties
Properties Gross Leasable Area
8
Brimell Toyota Scarborough, ON December 2018 $26.0 million
9
Ericksen Infiniti Edmonton, AB Go Mazda Edmonton, AB March 2017 $8.0 million Porsche Centre / Jaguar Land Rover Edmonton, AB December 2015 $23.0 million BMW Laval Montreal, QC Sherwood Park VW Edmonton, AB 9 Dealership Portfolio Ottawa & Kingston, ON December 2018 $101.4 million for 303,817 SF across 6 properties
designated for ancillary dealership services Pfaff Audi Vaughan, ON September 2016 $17.2 million McNaught Cadillac Buick GMC Winnipeg, MB
Winnipeg, MB Tesla KW (service centre) Kitchener-Waterloo, ON February 2018 $7.5 million $55.5 million for two-property portfolio (Sept. 2018) $24.0 million for two-property portfolio (March 2019) Abbotsford VW Abbotsford, BC Guelph Hyundai Guelph, ON Wellington Motors Guelph, ON $30.4 million for three-property portfolio (June 2019)
$23.2 million for three-property Portfolio (December 2017)
Southtown Hyundai Edmonton, AB Kentwood Ford Edmonton, AB
December 2016 $14.3 million Mercedes-Benz West Island Dollard-des-Ormeaux, QC December 2016 $20.3 million Barrie Volkswagen Barrie, ON March 2017 $8.9 million Mazda des Sources Dorval, QC December 2017 $8.0 million Heritage Honda Calgary, AB April 2017 $23.6 million Audi Barrie Barrie, ON January 2016 $11.1 million Toyota Woodland Montreal, QC December 2015 $7.2 million Country Hills Volkswagen Calgary, AB June 2018 $18.0 million
10
11
At July 2015 IPO June 30, 2019
Regina 18% Regina 8.2% GTA 27.8% Calgary 12.2% GVA 7.9% GMA 14.2% Edmonton 7.8% Ottawa / Kingston 13.6% Winnipeg 4.3% GVA 18% Calgary 18% GTA 46%
Markets > (By GLA) Investment Properties > Market capitalization >
Dilawri 100%
(1) As at August 28, 2019
K-W/ Guelph 3.9%
Tenants > Base Rent
12
50% 15% 35%
Proportion of Canada’s ~ 3,500 Auto Dealerships Owned by Size of Ownership Group1
5 or more Dealerships Single Dealership 2-4 Dealerships
10 Dealership Groups: Approximately 10% of the Market
(1) Source: DesRosiers Automotive Consultants Inc. (2) Information based on publicly available information as at December 31, 2018 (3) Denotes current tenants of the REIT (4) Excludes collision centres and RV/Marine dealerships
Company Dealerships % of Total Dilawri Group (2) (3) 72 2.1% AutoCanada(2) (3) 57 1.6% Go Auto(2)(3)(4) 40 1.1% Performance Group (2) 32 0.9% Albi Group (2) 30 0.9% Zanchin Automotive Group(2) 30 0.9% Steele Automotive Group (2) 37 1.1% Gabriel-Prestige-President Group(2) 32 0.9% O’Regan Group(2) 26 0.7% Murray Auto Group(2) 33 0.9% Top 10 subtotal 389 11% Other 3,120 99% Total 3,509(1) 100.0%
CONTINUED FOCUS ON DEALERSHIP MODEL AND CONSOLIDATION
production by existing OEMs for 2019 – 2022
to be regulated
13
PROVIDING FINANCIAL LIQUIDITY TO DEALERSHIP OWNERS TO SUPPORT THE ADVANCEMENT OF THEIR STRATEGIC OBJECTIVES
» Succession planning » Monetization of embedded capital » Wealth diversification / Tax efficient Class B LP Units » Invest in core business
Established Dealers Industry Consolidators
» Redeploy capital from underlying real estate in existing portfolio » Fund acquisition program / expand presence in emerging institutional asset class » Realize higher investment returns from core business » Strengthen competitive position / expedite economies of scale
Consolidation of Canada’s fragmented dealership industry provides ample partnership opportunities
14
Weighted average term
(swaps)
Weighted average fixed interest rate
Portion of total debt at fixed interest rates¹
Effective occupancy
Same Property Cash NOI growth YoY as a result of contractual annual rent increases1
Debt to GBV (50% - 60% target range)
Weighted average lease term1
1) As at June 30, 2019
16
RELIABLE LONG-TERM CASH FLOW, WITH CONTRACTED, LONG-TERM RENTAL INCOME GROWTH AND ONLY ONE LEASE EXPIRATION BEFORE 2026
17
Pfaff Automotive Partners)
properties over the next 6.9 – 17.5 years
Lease Maturity Schedule2
(1) As at June 30, 2019 (2) Based on 12-month rolling average as at June 30, 2019 2.1% 2.8% 4.2% 6.8% 7.0% 9.0% 8.7% 9.0% 8.5% 7.0% 7.5% 13.4% 3.9% 10.1%
2.0 3.0 4.0 5.0
'19 '20 '21 '22 '23 '24 '25 '26 '27 '28 '29 '30 '31 '32 '33 '34 '35 '36 '37 '38
10% 15% 20% 25% % of Cash NOI
18
representing ~30 brands
Dilawri development and acquisition pipeline
representing 20 brands
representing 27 brands
AB, BC and United States
representing ~15 brands
representing 10 brands
representing 6 brands
19
(1) As at December 31, 2018 (2) As at June 30, 2019 (3) Mass Market segment includes: Chrysler, Ford, General Motors, Kia, Nissan (including Infiniti), Honda, Hyundai, Mazda, Mitsubishi, Subaru, Toyota and Volkswagen (4) Luxury segment includes: Acura, Audi, BMW, Infiniti and Lexus (5) Ultra-Luxury segment includes: Aston Martin, Bentley, Lamborghini, Land Rover, Lincoln, Porsche, Maserati, McLaren and Mercedes-Benz
Other 14.2% 13.9% 11.4% 9.5% 7.2% 6.3% 4.4% 3.9% 3.8% 3.7% 3.7% 3.7% 2.8% 2.0% 1.8% 0.9% 0.8% 0.7% 0.7% 4.6%
North America 7% Europe 40% Asia 53% Manufacturers by Region (% of GLA from Dealership Properties)1 Ultra Luxury5 10% Mass Market3 58% Luxury4 32% Brands by Market Segment (% of GLA from Dealership Properties)1 7 9 6 5 4 5 2 3 2 4 2 4 1 4 1 2 1 1 2 8 # of REIT Locations Manufacturer / Brand (By % of Dealership GLA)2
20
At March 31, 2019 ($000s) Maturity Principal Amount Effective Fixed Rate of Interest Amount withdrawn against Revolving Credit Facility Repayment Facility 11 June 2023 $198,755 3.75% $0 of $30,000 Open Facility 22 June 2024 $102,189 3.53% $0 of $15,000 Open Facility 33 December 2023 $92,625 4.05% $0 of $30,000 Open Mortgages Multiple $27,822 3.51% n/a Closed Total/Weighted Average: $421,194 3.78% $0 of $75,000
(1) Facility 1 consists a non-revolving loan worth $198.8 million and a $30 million revolving credit facility (of which nil was drawn as at June 30, 2019, and of which $0.8 million is secured for irrevocable letters
(2) Facility 2 consists of a non-revolving loan worth $102.2 million, and a $15 million revolving credit facility (of which nil was drawn as at June 30, 2019) (3) Facility 3 consists of a non-revolving loan worth $92.6 million, and a $30 million revolving credit facility (of which nil was drawn as at June 30, 2019)
MANAGEMENT & TRUSTEES FOCUSED ON AFFO PER UNIT GROWTH AND SOUND GOVERNANCE
21
Name & Domicile Principal Occupation Louis Forbes
Ontario, Canada
Former Senior Vice President and Chief Financial Officer CT Real Estate Investment Trust Patricia Kay
Massachusetts, US
Former Senior Vice President, Dealer Finance – Bank
Stuart Lazier
Ontario, Canada
Chairman, Northbridge Investment Management Inc. John Morrison
Lead Trustee Ontario, Canada
Vice Chairman Choice Properties Real Estate Investment Trust Kapil Dilawri
Chair Ontario, Canada
Co-founder of the Dilawri Group and Vice President and Secretary of Dilawri James Matthews
Ontario, Canada
Chief Financial Officer of the Dilawri Group
Strong Majority Independent Board
a cost-recovery basis
acquisition, financing or leasing)
upon 90 days' notice
REIT-Friendly Management Structure
8,906 13,107 2018 2019
23
Cash NOI ($000s) Property Revenue ($000s)
(1) Same Property Revenue excludes straight line rent adjustments
11,373 16,425 2018 2019 6,640 8,754 2018 2019
Funds From Operations ($000s)
5,842 7,948 2018 2019
Adjusted Funds From Operations ($000s) Same Property Revenue1:
Same Property Cash NOI:
$0.252 79.8%
Payout Ratio per Unit (diluted)
$0.222 90.7%
Payout Ratio per Unit (diluted)
Payout Ratio per Unit (diluted)
Payout Ratio per Unit (diluted)
($000s)
($000s, except per unit amounts and payout ratios) Six months ended June 30, 2019 Six months ended June 30, 2018 Variance Revenue from investment properties $ 32,109 $ 22,679 41.6% Cash NOI 25,761 17,752 45.1% Same property Cash NOI 17,986 17,701 1.6% FFO 17,335 13,307 30.3% AFFO 15,706 11,710 34.1% Per Unit Amounts / Payout Ratios Distributions $ 0.402 $ 0.402
0.541 0.506 0.035 AFFO (diluted) 0.490 0.445 0.045 FFO payout ratio 74.3% 79.4%
AFFO payout ratio 82.0% 90.3%
24
ALIGNMENT OF INTERESTS THROUGH DILAWRI’S 26.2% EFFECTIVE OWNERSHIP INTEREST IN THE REIT
26
development and acquisition pipeline
dealerships per year, including two to three automotive dealership properties
as at June 30, 2019 (LTM)
as at June 30, 2018 (LTM)
$1,641 $2,000 $2,400 $2,810 $3,000
2014 2015 2016 2017 2018
Dilawri 5-Year Historical Revenues ($millions)
EBITDA $75.2 $76.6 $72.8 $94.8 $85.6
CAGR of ~3%