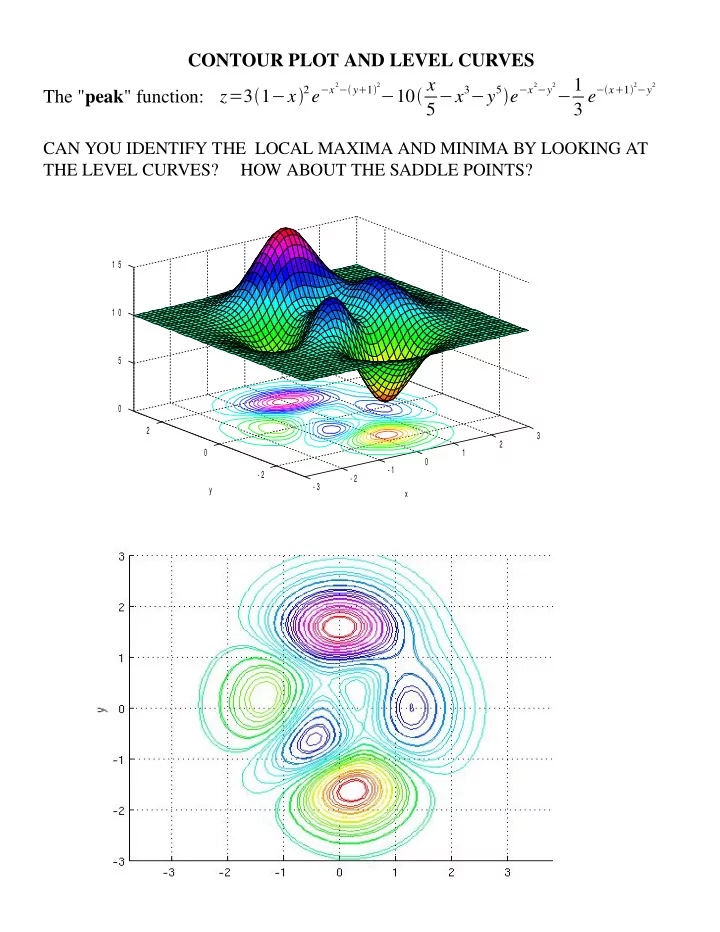
contour plot and level curves

CONTOUR PLOT AND LEVEL CURVES 1 2 y 1 2 10 x 2 y 2 2 y 2 - PDF document

CONTOUR PLOT AND LEVEL CURVES 1 2 y 1 2 10 x 2 y 2 2 y 2 The " peak " function: z = 3 1 x 2 e x 5 x 3 y 5 e x 3 e x 1 CAN YOU IDENTIFY THE LOCAL MAXIMA


  1. CONTOUR PLOT AND LEVEL CURVES − 1 2 − y  1  2 − 10  x 2 − y 2 2 − y 2 The " peak " function: z = 3  1 − x  2 e − x 5 − x 3 − y 5  e − x 3 e − x  1  CAN YOU IDENTIFY THE LOCAL MAXIMA AND MINIMA BY LOOKING AT THE LEVEL CURVES? HOW ABOUT THE SADDLE POINTS? 1 5 1 0 5 0 2 3 2 0 1 0 - 1 - 2 - 2 - 3 y x

  2. Answer: x ≈ 1.28 , y ≈− 0.0048 Local Maximum x ≈ .228 , y ≈− 1.625 Local minimum x ≈− .460 , y ≈− .629 Local Maximum x ≈− 1.35 , y ≈ .204 Local minimum x ≈− 0.01 , y ≈ 1.58 Local Maximum x ≈ .296 , y ≈ .320 Local minimum x ≈− .266 , y ≈ .467 Saddle point x ≈ .416 , y ≈− .394 Saddle point x ≈ 1.10 , y ≈ .854 Saddle point Below, "m" stands for local minimum, "M" stands for local maximum and "S" stands for Saddle point.

Recommend


More recommend


Explore More Topics

Stay informed with curated content and fresh updates.