SLIDE 1
SLIDE 2
COVID 19 and Cycling: Panel Discussion October 28, 2020
Mark Greve, MD Moderator Michael Roshon, MD/PhD Kevin Sprouse, MD Aaron Baggish, MD
SLIDE 3
Agenda
Virology of SARS CoV-2
Transmission Testing Clinical Course
Cycling and Covid: Tales from the Tour Cardiac Sequelae Discussion
SLIDE 4
SLIDE 5
Entry via the ACE2 receptor
– Explains the tropism for the lung – Highly expressed on type 2 pneumocytes – Surfactant production is decreased
ARDS
– Also expressed in intestinal epithelium and vascular endothelium – Increased expression with hypertension, Diabetes, heart failure, age
May explain the increased susceptibility and disease severity with age and comorbidity
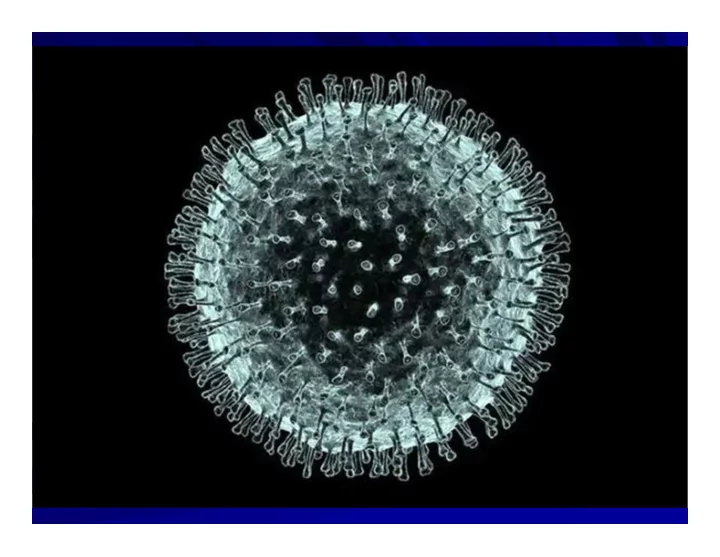
SLIDE 6 Goldsmith, CS et al. Ultrastructural Characterization of SARS Coronavirus, February 2004 Emerging infectious diseases 10(2):320-6
SLIDE 7
Replicase
– Virus replication depends on the viral replicase
Minimal error detection Very high mutation rate Viral strains
– Potential for therapy
SLIDE 8 https://nextstrain.org/ncov Accessed 5/5/2020
SLIDE 9 Incubation and Symptoms
Incubation Period: Within 14 days. Onset
- f symptoms usually within 2-7 days of
exposure with median of 4-5 days Symptoms
– Fever 99% over course of disease – Dry cough (45-80%) – URI Sx (5-25%) – GI Sx (10-20%) – Taste/Smell alterations
SLIDE 10 Spectrum of Disease
- 81%: No/mild sx
- 14% Severe
- 5% with critical
disease and resp failure, shock, MOF
5.8%
Verity, R et.al. Estimates of the severity of coronavirus disease 2019: a model-based analysis. Lancet 3/30/2020. https://doi.org/10.1016/S1473-3099(20)30243-7
SLIDE 11 Spectrum of Disease: Cyclists
- Almost all have symptoms
- Almost all have mild sx
- GI symptoms may be more frequent
- Multiple studies of pts with mild symptoms
- Up to 25% may have diarrhea only
- My anecdotal experience
SLIDE 12 Zhou, Fei et.al. Clinical course and risk factors for mortality of adult inpatients with COVID-19 in Wuhan, China: a retrospective cohort study. Lancet 3/11/2020. DOI:https://doi.org/10.1016/S0140-6736(20)30566-3
Disease Course
SLIDE 13 Siddiq et al. COVID-19 illness in native and immunosuppressed states: A clinical−therapeutic staging proposal. http://www.jhltonline.org
Disease Phases
SLIDE 14 Siddiq et al. COVID-19 illness in native and immunosuppressed states: A clinical−therapeutic staging proposal. http://www.jhltonline.org
Phases Guide Therapy
Decrease Replication Reduce Lung Damage Decrease Cytokines Remdesivir Supportive Anti IL-6 Tociluzimab
? Steroids Anti IL-1R Anakinra Monoclonal Ab / HI IVIG BTK Inhibitors Calquence Reduce immune suppression Steroids No Steroids!
SLIDE 15 Zhou, Fei et.al. Clinical course and risk factors for mortality of adult inpatients with COVID-19 in Wuhan, China: a retrospective cohort study. Lancet 3/11/2020. DOI:https://doi.org/10.1016/S0140-6736(20)30566-3
Disease Course
SLIDE 16
Therapy The Trump Way
Test Frequently / Treat Early Remdesir Regeneron (2 anti-spike Monoclonal Ab) Steroids It works!
SLIDE 17
Transmission
Reproduction number – R0
– Average number of people infected by one sick person – Generally if that number is greater than one, then the virus will spread
SARS CoV-2 features that contribute to spread
– Presymptomatic carriers – Period of spreading before symptoms – Very high susceptibility- no herd immunity
SLIDE 18
Influenza
SLIDE 19 How the SARS-CoV-2 compares with other infectious diseases
Image credit: (New York Times)
SLIDE 20
Transmission paradox
While the initial Reproduction number (R0) was 2.4...
– Extensive contact tracing studies confirm that 70% of patients transmit the virus to 0 others – Attack rate among close family contacts of infected individuals remains at around 15- 20%
Yet there are “superspreader” events that transmit to large numbers
SLIDE 21
Modes of Transmission
Viral respiratory infections can be transmitted by contact, droplet or respiratory (airborne) modes.
– Typically not more than 3 feet
Airborne transmission is driven by the droplet size: If less than 5 microns then it floats Examples of naturally occurring airborne viruses:
– Varicella, Smallpox, measles
SLIDE 22
SARS CoV-2 Transmission
Droplet and Contact - confirmed
– ? Stool – ? Airborne
SLIDE 23 Aerosol and surface stability of SARS-CoV-2
Virus detected up to 72 hours on hard sufaces, 4 hours
3 hours in aerosols Experimental creation of aerosolized SARS CoV-2 – “In short, aerosols (<5 μm) containing HCoV-19 were generated using a 3-jet Collison nebulizer and fed into a Goldberg drum to create an aerosolized environment” – Experimentally produced aerosols Does not represent the clinical scenario
van Doremalen N, Bushmaker T, Morris DH, et al. Aerosol and surface stability of SARS-CoV-2 as compared with SARS-CoV-1. N Engl J Med
SLIDE 24
Droplet?
SLIDE 25
SLIDE 26 Viral Shedding vs RT PCR
Virological assessment of hospitalized cases of coronavirus disease 2019. Wolfel, R et al.
SLIDE 27 Real World Experience With SARS CoV-2 Transmission
Primarily Droplet and Contact
– Analysis of more than 75,000 cases did not indicate airborne transmission – Air sampling of cases of patients with high viral load did not detect airborne virus 10cm (4 inches) from coughing patient - Negative 4 hours x 5L/ min – Negative – Nebraska study: Air samples positive by rt-PCR – Samples collected near the patient (bedside desk) – NO viral culture
medRxiv preprint doi: https://doi.org/10.1101/2020.03.23.20039446
SLIDE 28
PPE- Actual experience
Wuhan- 1300 healthcare workers infected
– 3X the normal population – Imported 42,000 additional HCW
None became infected – strict PPE
Singapore (0) / Hong Kong (0)
– Basic mask, hand hygiene, distance – N95, goggles and gown only high risk cases and for aerosolizing procedure
SLIDE 29 Case Report- Hong Kong
Patient with a high viral load
– 11 unprotected exposures
no transmission
– Samples from air with coughing, no mask (10cm)
Negative
Samples from room
– 12/13 negative, 1/13 positive
– Cheng, V., Wong, S., Chen, J., Yip, C., Chuang, V., Tsang, O., . . . Yuen, K. (n.d.). Escalating infection control response to the rapidly evolving epidemiology of the Coronavirus disease 2019 (COVID-19) due to SARS-CoV-2 in Hong Kong. Infection Control & Hospital Epidemiology, 1-24. doi:10.1017/ice.2020.58
SLIDE 30 Case report - Singapore
Pt intubated x 3 days, then extubated, bipap
– Then tested positive for SARS CoV-2
41 HCW exposed to aerosol generating procedure for over 10 minutes
– No positives – 85% surgical mask only
– ”Our observation is consistent with previous studies that have been unable to
show that N95 masks were superior to surgical masks for preventing influenza infection in health care workers”
Ng K, Poon BH, Kiat Puar TH, et al. COVID-19 and the Risk to Health Care Workers: A Case Report. Ann Intern Med. 2020; [Epub ahead of print 16 March 2020]. doi: https://doi.org/10.7326/L20-0175
SLIDE 31 US experience
UC Davis
– 85 HCW quarantined after exposure to Covid19 patient without protection
All tested negative
Sacramento, Seattle, and San Francisco became coronavirus hot spots
– significant occupational transmission has not been found.
“Transmission seems to occur primarily through sustained exposure in the absence of basic protection or through the lack of hand hygiene after contact with secretions.”
Gawande, The New Yorker. 3/21/2020
SLIDE 32
SLIDE 33 Flattening the Curve
When early intervention does not happen, transmission accelerates and peaks prior to management and/or independent decrease in Ro. VOX.COM
SLIDE 34
Testing
Three basic methods
– Viral culture: Inoculate a sample into a cell culture that is know to support viral replication
Slow – but correlated to infectivity
– PCR – Polymerase Chain Reaction. Amplifies fragments of the viral genome (RNA)
Faster – 4-6 hours, but typically batched
– Antigen detection
SLIDE 35 RT-PCR Test Performance
Sample site / Severity / Timing Bronchoalveolar Lavage 100% except mild disease / late testing
– Yang et almedRxiv preprint doi: https://doi.org/10.1101/2020.02.11.20021493
0-7 days Sputum 82% 89% Nasal 73 72 Throat 61 60 8-14 days Sputum 83 74 Nasal 53 72 Throat 30 50 Mild Severe
SLIDE 36
- Abbott Labs isothermal nucleic acid amplification / detection system
- Promises positive results in as little as 8 minutes
- negative results in 30 minutes
- Same caveats as RT=PCR, but faster.
- Accuracy not known
SLIDE 37 Real-World Performance or Abbott ID Now
545 Paired swabs
– Positive agreement = 75% – Negative agreement = 99%
– “Overall, the ID Now COVID-19 assay was associated with lower performance characteristics compared to the Abbott RealTime SARS-CoV-2 assay.”
Comparison of Abbott ID Now (IDNCOV) and Abbott m2000 Methods for the Detection of SARS-CoV-2 from Nasopharyngeal and Nasal Swabs from Symptomatic Patients (Harrington, August 2020).
SLIDE 38 Antigen Testing
Manufacturer data claims high sensitivity and specificity Real world data is less rosy The detection limits between RAD test, viral culture and RT- PCR varied hugely. RAD was 1000 fold less sensitive than viral culture while RAD was 100K fold less sensitive than RT- PCR. The RAD test detected between 11.1 % and 45.7 % of RT- PCR-positive samples from COVID-19 patients. – Up to 12% false positive
1/8 samples negative by PCR and Culture tested positive with the antigen test
Mak et al, Evaluation of rapid antigen test for detection of SARS-CoV-2 virus https://doi.org/10.1016/j.jcv.2020.104500
SLIDE 39 Serology
Tests for host antibody
– IgM = Recent infection – IgG = Remote infection
One test approved
– Cellex, Inc.
– 93.8% Sensitivity – 95.6% Specificity Compared to RT-PCR
Whole blood – 15-20 minutes
SLIDE 40
Key Questions
– Modes of transmission – Asymptomatic infection – Immunity after infection – Vaccine development