
SLIDE 1
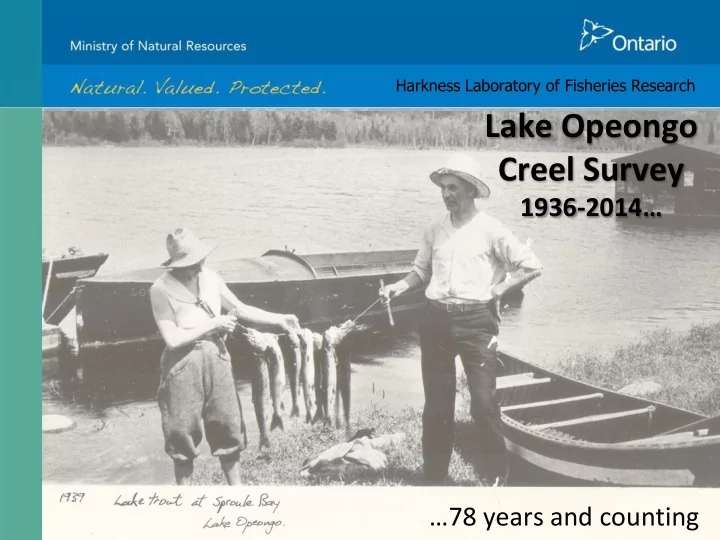
Lake Opeongo Creel Survey
1936-2014… …78 years and counting
Harkness Laboratory of Fisheries Research
Creel Survey 1936- 2014 78 years and counting Build it and they will - - PowerPoint PPT Presentation
Harkness Laboratory of Fisheries Research Lake Opeongo Creel Survey 1936- 2014 78 years and counting Build it and they will come.. Highway 60 near Lake of Two Rivers 1950s Opeongo road - 1942 Establishment of Harkness Lab - 1936
Harkness Laboratory of Fisheries Research
Highway 60 near Lake of Two Rivers – 1950’s
Lake Opeongo
10 20 30 40 50 60 70 80 1955 1960 1965 1970 1975 1980 1985 Thousands of Campers Year
Algonquin Park Interior Campers
1 2 3 4 5 6 1990 1995 2000 2005 2010 2015 Day Trip/Overnight CUE Year
Daytrip/Overnight CUE
500 1000 1500 2000 2500 3000 3500 4000 4500 5000 10000 15000 20000 25000 30000 35000 40000 45000 50000 1925 1935 1945 1955 1965 1975 1985 1995 2005 2015
Total Harvest of Lake Trout Lake Trout Targetted Effort (angler hours) Year
Lake Opeongo Lake Trout Harvest and Effort (1936-2012)
Establishment of Smallmouth Bass Establishment of Lake Herring
0.1 0.2 0.3 0.4 0.5 0.6 1000 2000 3000 4000 5000 6000 7000 1940 1950 1960 1970 1980 1990 2000 2010
Harvest per Unit Effort Number of Adult Lake Trout (8-20 years) Year
Lake Opeongo Adult Lake Trout Population (8-20 years of Age)
Reproduced from Vascotto, 2006
500 1000 1500 2000 2500 3000 3500 4000 4500 5000 10000 15000 20000 25000 30000 35000 40000 45000 50000 1925 1935 1945 1955 1965 1975 1985 1995 2005 2015
Total Harvest of Lake Trout Lake Trout Targetted Effort (angler hours) Year
Lake Opeongo Lake Trout Harvest and Effort (1936-2012)
Establishment of Smallmouth Bass Establishment of Lake Herring
500 1000 1500 2000 2500 3000 3500 4000 4500 5000 10000 15000 20000 25000 30000 35000 40000 45000 50000 1925 1945 1965 1985 2005 2025
Total Harvest of Lake Trout Lake Trout Targetted Effort (angler hours) Year
Lake Opeongo Lake Trout Harvest and Effort (1936-2012)
Establishment of Smallmouth Bass Establishment of Lake Herring First Rock Bass Observation