Demand facing Overall Market And Marginal Firm Loy Yang A Loy Yang - - PowerPoint PPT Presentation

demand facing overall market and marginal firm loy yang a
SMART_READER_LITE
LIVE PREVIEW

Demand facing Overall Market And Marginal Firm Loy Yang A Loy Yang - - PowerPoint PPT Presentation

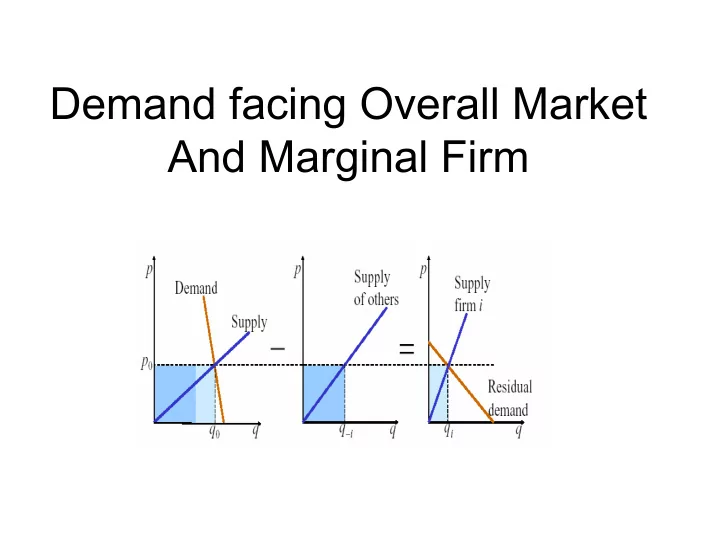
Demand facing Overall Market And Marginal Firm Loy Yang A Loy Yang B Newport Bayswater Stanwell Tarong Average Annual Price $ per MWh 70 60 50 NSW VIC 40 QLD 30 SA 20 SNOWY 10 0 1999- 2000- 2001- 2002- 2003/4 2000 2001


slide-1
SLIDE 1

Demand facing Overall Market And Marginal Firm

slide-2
SLIDE 2

Loy Yang A

slide-3
SLIDE 3

Loy Yang B

slide-4
SLIDE 4

Newport

slide-5
SLIDE 5

Bayswater

slide-6
SLIDE 6

Stanwell

slide-7
SLIDE 7

Tarong

slide-8
SLIDE 8

Average Annual Price

10 20 30 40 50 60 70 1999- 2000 2000- 2001 2001- 2002 2002- 2003 2003/4 NSW VIC QLD SA SNOWY $ per MWh

slide-9
SLIDE 9

Forward Market for Electrcity

slide-10
SLIDE 10
  • Year

Max capacity (MW)

  • Oakey Creek

1999 344

  • Roma

1999 84

  • Callide C

2001 1000

  • Millmerran

2002 900

  • Swanbank E

2002 410

  • Total Qld

2738

  • NSW Redbank

2001 150

  • Bairnsdale

2001 94

  • Somerton

2002 160

  • Valley Power

2002 390

  • Total Vic

644

  • Ladbroke

2000 100

  • Pelican Point

2001 510

  • Quarantine

2001 100

  • Hallett

2002 220

  • Total SA

930

  • NEM Total

4462