
SLIDE 1
Demands Border Adjustments N ow John Odell ERCST 27 September 2019 - - PowerPoint PPT Presentation
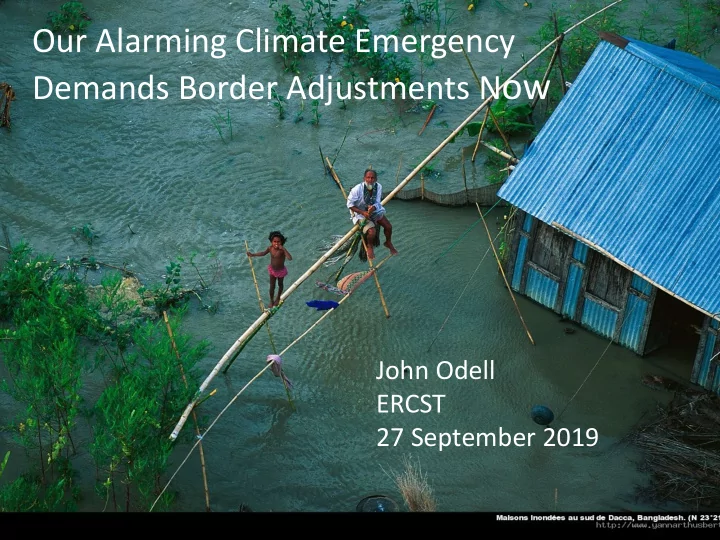
Our Alarming Climate Emergency Demands Border Adjustments N ow John Odell ERCST 27 September 2019 A new proposal for border carbon adjustments Primary goal: induce governments of high-polluting countries to improve their policies to reduce
Country CO2 per capita 2014 Total CO2 2015 Energy tax rate Metric tonnes per capita Territorial emissions in million tonnes CO₂ Euros per tonne of CO2 emissions Qatar 45.4 91.0 Trinidad and Tobago 34.2 45.0 Kuwait 25.2 102.0 Bahrain 23.4 33.0 United Arab Emirates 23.3 177.0 Brunei Darussalam 22.1 9.1 Saudi Arabia 19.5 600.5 Luxembourg (EU28) 17.4 10.0 93.64 United States 16.5 5,413.6 4.83 Oman 15.4 63.0 Australia 15.4 399.7 19.55 Canada 15.1 557.0 7.72 Estonia (EU28) 14.8 20.0 25.70 Kazakhstan 14.4 235.0 Turkmenistan 12.5 91.0 Palau 12.3 0.2 Russian Federation 11.9 1,617.3 0.01 Korea, Rep. 11.6 592.2 26.47 Singapore 10.3 55.0 Netherlands (EU28) 9.9 162.0 87.98 Japan 9.5 1,237.3 37.41 Norway 9.3 44.0 93.25 Czech Republic (EU28) 9.2 96.0 31.55 Libya 9.2 54.0 South Africa 9.0 462.2 13.86 Germany (EU28) 8.9 798.3 58.26 Finland (EU28) 8.7 44.0 60.18 Belgium (EU28) 8.3 100.0 45.63 Iran, Islamic Rep. 8.3 647.5 Malaysia 8.0 249.0 Israel 7.9 72.0 73.33 New Zealand 7.7 36.0 31.33 Poland (EU28) 7.5 315.8 25.50 China 7.5 10,357.1 3.40 Ireland (EU28) 7.4 37.0 77.13 Ref: OECD MEDIAN 7.15
To find this online, search “alarming climate border.”
Country CO2 per capita 2014 Total CO2 2015 Energy tax rate Metric tonnes per capita Territorial emissions in million tonnes CO₂ Euros per tonne of CO2 emissions United States 16.5 5,413.6 4.83 Russian Federation 11.9 1,617.3 0.01 Japan 9.5 1,237.3 37.41 Norway 9.3 44.0 93.25 Germany (EU28) 8.9 798.3 58.26 China 7.5 10,357.1 3.40 Ref: OECD MEDIAN 7.15 Ref: European Union 6.4 France (EU28) 4.6 339.9 61.12 Gabon and WORLD MEDIAN 2.8 5.0 India 1.7 2,274.3 3.12