
SLIDE 1
Determining wildlife population and habitat status in the Thunder Bay Area of Concern
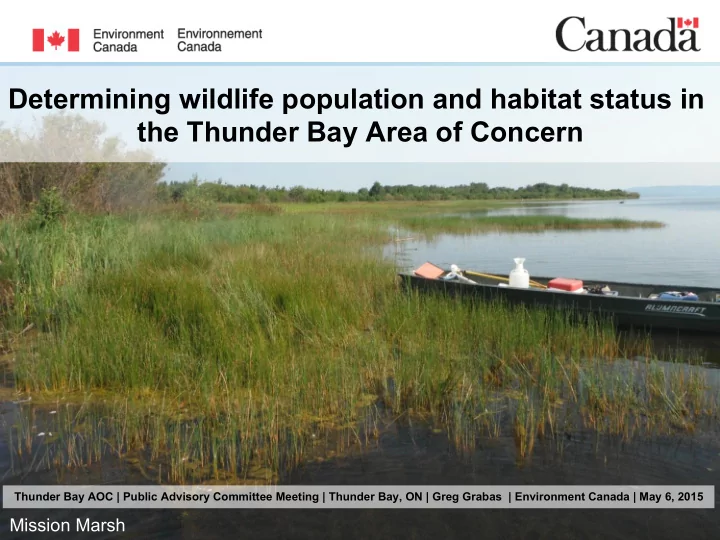
Thunder Bay AOC | Public Advisory Committee Meeting | Thunder Bay, ON | Greg Grabas | Environment Canada | May 6, 2015
Determining wildlife population and habitat status in the Thunder - - PowerPoint PPT Presentation
Determining wildlife population and habitat status in the Thunder Bay Area of Concern Thunder Bay AOC | Public Advisory Committee Meeting | Thunder Bay, ON | Greg Grabas | Environment Canada | May 6, 2015 Mission Marsh Delisting Criteria -
Thunder Bay AOC | Public Advisory Committee Meeting | Thunder Bay, ON | Greg Grabas | Environment Canada | May 6, 2015
Page 2 – August 12, 2015
That the wildlife community (at a population level) does not differ significantly from suitable Lake Superior reference sites. Or Monitoring data shows that the wildlife community (at a population level) does not differ significantly from the abundance that would be expected from the amount and quality of physical, chemical, and biological habitat typical of the Area of Concern.
This beneficial use will no longer be impaired when riparian, wetland, and coastal habitat within the Thunder Bay AOC is in compliance with the guidelines set out through Environment Canada's How Much Habitat is Enough? (2004) – Habitat Change Detection Analysis (2012). In addition, remaining and created wetlands must be protected from further degradation through existing environmental legislation. Provincial standards should be used to inventory and classify wetlands within the Thunder Bay AOC.
Site 2 1 American Bittern 2 American White Pelican 3 Bald Eagle 2 Barn Swallow 2 Belted Kingfisher 1 Brown-headed Cowbird 6 Blue-winged Teal 3 Clay-colored Sparrow 4 Common Merganser 5 Common Nighthawk 2 Common Raven 12 Common Yellowthroat 14 Double-crested Cormorant 1 Great Blue Heron 3 Green-winged Teal 2 Herring Gull 5 Mallard 7 Red-winged Blackbird 4 Sora 3 Song Sparrow 2 Wood Duck 1 White-throated Sparrow 1 Yellow-rumped Warbler 1 Yellow Warbler Site 1 3 American Bittern 1 Common Yellowthroat 4 Great Blue Heron 4 Green-winged Teal 1 Herring Gull 2 Mallard 1 Merlin 2 Osprey 4 Red-breasted Merganser 20 Red-winged Blackbird 4 Sora 5 Swamp Sparrow 2 Swainson's Thrush 1 Tree Swallow 1 Veery 3 Wood Duck 1 White-throated Sparrow 1 Yellow-rumped Warbler 1 Yellow Warbler
Swamp Sparrow American Bittern Sora
Page 4 – August 12, 2015
Page 5 – August 12, 2015
Page 6 – August 12, 2015
Page 7 – August 12, 2015
Page 8 – August 12, 2015
N 200 200 400 Meters
Open Water Wetland Beach and Bluff Woodlot and Forest Pasture and Idle Field Crop and Improved Residential Non-Residential Development Utility and Transportation
Page 10 – August 12, 2015
Sturgeon Bay 7.01 Anderson Creek 5.74 Flathead Harbour 7.00 Carpin Beach 6.20 Cloud Bay 6.84 Desbarats Wetland 6.69 Northern Wood Preservers Marsh 6.81 Echo Bay 6.14 Mission Marsh 6.57 Hay Bay Wetland 4.56 Pine Bay 5.92 Joe Dollar Bay Wetland 6.22 Hurkett Cove 5.88 Lake George 4.43 Brule Bay 5.78 Maskinonge Bay 7.19 Blende Rivermouth Wetland 5.43 Pumpkin Point 4.12 Chippewa Marsh 5.43 Stobie Creek 6.57 Neebing Marsh 5.09 West Shore, St. Joseph Island 3.24
Page 11 – August 12, 2015
Page 12 – August 12, 2015
Page 14 – August 12, 2015
Page 15 – August 12, 2015
Page 16 – August 12, 2015
Page 17 – August 12, 2015
Page 18 – August 12, 2015
Page 19 – August 12, 2015
Page 20 – August 12, 2015
Page 21 – August 12, 2015
Page 22 – August 12, 2015
Page 23 – August 12, 2015
Page 24 – August 12, 2015