Directors Presentation FY19 Audit Committee & Board of Directors - - PowerPoint PPT Presentation

director s presentation fy19
SMART_READER_LITE
LIVE PREVIEW

Directors Presentation FY19 Audit Committee & Board of Directors - - PowerPoint PPT Presentation

Directors Presentation FY19 Audit Committee & Board of Directors Meeting Investor Presentation FY19 May 7, 2019 (CIN: L85110KA1995PLC019126) Artists Impression: Brigade 1 Cornerstone Utopia FINANCIAL HIGHLIGHTS Revenue


slide-1
SLIDE 1

Director’s Presentation–FY19

Audit Committee & Board of Directors Meeting

1

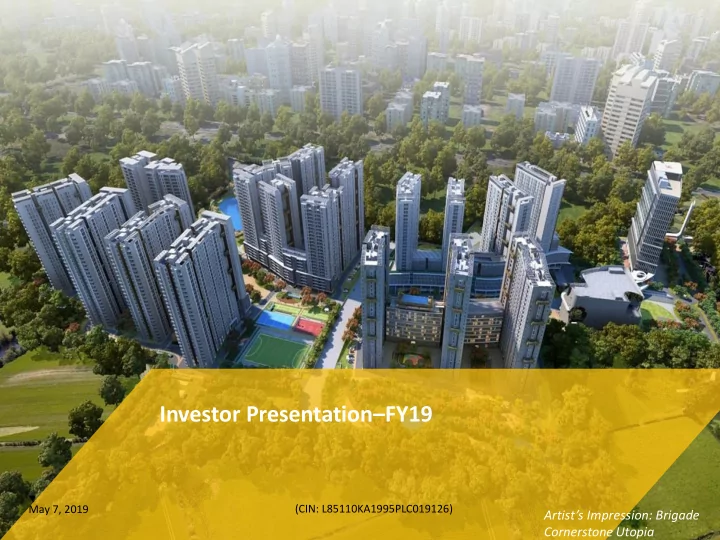
Investor Presentation–FY19

Artist’s Impression: Brigade Cornerstone Utopia

May 7, 2019 (CIN: L85110KA1995PLC019126)

slide-2
SLIDE 2

FINANCIAL HIGHLIGHTS

2

  • Revenue for FY19 is Rs.30,273 Mn
  • EBITDA for FY19 is Rs. 8,442 Mn , EBITDA Margin at 28%
  • PBT for FY19 is Rs. 4,257 Mn , PBT Margin at 14%
  • PAT for FY19 is Rs. 2,819 Mn
  • PAT (after MI) for FY19 is Rs. 2,399 Mn
  • PAT Margin at 9% for FY19

*PAT : Profit After Tax, PBT: Profit Before Tax, EBITDA: Earnings before Interest Tax Depreciation Amortization ,MI : Minority Interest

  • Revenue for Q4FY19 is Rs.7,779 Mn → 11% increase over Q3FY19 Rs. 6,980 Mn
  • EBITDA for Q4FY19 is Rs.2,332 Mn , EBITDA Margin at 28% → 25% increase over

Q3FY19 Rs.1,862 Mn

  • PBT for Q4FY19 is Rs. 1,144 Mn → 36% increase over Q3FY19 is Rs. 845 Mn
  • PAT (after MI) for Q4 FY19 is Rs. 597 Mn → 22% increase over Q3FY19 is Rs. 489 Mn
  • Net Debt as on 31st March 2019 is Rs 29,551 Mn.
  • Net Debt to Equity Ratio is 1.05:1
  • Average cost of debt is 9.63%.
slide-3
SLIDE 3

3

OPERATIONAL HIGHLIGHTS

Sales Highlights:

  • Achieved 2.97 Mn sq ft of sales in FY19 vs 1.57 Mn sq ft in FY18 (89% increase)
  • Sale value of Rs 16,440 Mn in FY19 vs 8,963 Mn in FY18. (83% increase)
  • Achieved 0.96 mn sq ft of new sales in Q4FY19 vs 0.43 mn sq ft IN Q4FY18 (125%

increase)

  • Sale value of Rs 5,198 Mn in Q4FY19 vs Rs 2,347 Mn in Q4FY18 (121% increase)

Hospitality Updates:

  • Four Points by Sheraton, Kochi opened in Jan-19 with 218 keys, taking total operational

keys to 1194 across 6 hotels

  • EBITDA for Hospitality segment increased to 35% in Q4FY19 vs 21% in Q3FY19, PBT at

breakeven. Leasing Updates: Leased 1.2 Mn sq ft of new office area in FY19 which is estimated to yield rental of 900Mn.

slide-4
SLIDE 4

CONSOLIDATED (IND-AS) FINANCIALS - SNAPSHOT

Amount in Rs. Mn

4

Particulars FY 19 (IND AS 115) Q4 FY 19 (IND AS 115) Q3 FY 19 (IND AS 115) Q4 FY 19 on Q3 FY 19 FY 18 * Q4 FY 18* Revenue 30,273 7,779 6,980 11% 19,455 4,477 EBITDA 8,442 2,332 1,862 25% 5,912 1,374 Interest 2,785 763 697 9% 2,594 746 Profit after Interest 5,657 1,569 1,165 35% 3,318 628 Depreciation 1,400 425 320 33% 1,377 372 PBT 4,257 1,144 845 36% 1,942 256

Add: Share of Profit from Associate

17 4 4

  • 15

1 Tax 1,455 428 251 71% 628 102 PAT 2,819 720 598 20% 1,329 155 PAT after MI 2,399 597 489 22% 1,392 181 EBITDA/Revenue 28% 30% 27% 30% 31% PBT/Revenue 14% 15% 12% 10% 6% PAT/Revenue

9% 9% 9%

7% 3%

*Since there is a change in accounting method, the current year numbers as per AS-115 cannot be compared

with the previous year figures *PAT : Profit After Tax, PBT: Profit Before Tax, EBITDA: Earnings before Interest Tax Depreciation Amortization ,MI : Minority Interest

slide-5
SLIDE 5

CONSOLIDATED (IND-AS) SEGMENT PROFIT ANALYSIS

Amount in Rs. Mn

5

Particulars Real Estate Hospitality Lease Rental Total % of Revenue Revenue 23,979 3,089 3,205 30,273 100% as % of Total 79% 10% 11% 100% Direct Expenses 15,345 505 97 15,947 53% Admin Expenses 1,584 998 614 3,196 11% Selling Cost 608 87 114 809 3% Employee cost 938 682 259 1,879 6% EBITDA 5,504 817 2,121 8,442 28% EBITDA / Revenue % 23% 26% 66% 28% Interest 1,123 441 1,221 2,785 9% Profit before Depreciation 4,381 376 900 5,657 19% Depreciation 117 632 651 1,400 5% PBT 4,264

  • 256

249 4,257 14% PBT / Revenue % 18%

  • 8%

8% 14% Income Tax 1,455 5% PAT 2,802 9%

*PAT : Profit After Tax, PBT: Profit Before Tax, EBITDA: Earnings before Interest Tax Depreciation Amortization ,MI : Minority Interest

slide-6
SLIDE 6

6

CONSOLIDATED SEGMENT CONTRIBUTION

0% 10% 20% 30% 40% 50% 60% 70% 80% Revenue EBITDA PBD 79% 65% 77% 10% 10% 7% 11% 25% 16% Real Estate Hospitality Lease Rentals

slide-7
SLIDE 7

Par artic icula lars Q1 FY19 Q2 FY19 Q3 FY19 Q4 FY19 FY19 FY18 Operating Activities Total Collections 4,622 6,082 5,527 6,185 22,416 17,922 Direct Cost/Construction Cost (2,059) (3,021) (3,714) (2,726) (11,520) (10,004) LO Payments (147) (120) (134) (207) (608) (445) Employee and Admin Expenses (784) (675) (709) (628) (2,796) (2,596) Sales & Marketing Expenses (139) (154) (170) (241) (703) (876) Statutory Payments (493) (392) (372) (763) (2,020) (2,393) Other Payments (10) (49) (33) (173) (265) (20) Net Cash Flow from Operating Activities (A) 990 1,671 396 1,447 4,504 1,588

CONSOLIDATED CASH FLOWS – (1)

Amount in Rs. Mn

7

Direct Method Cash Flows

Contd….

slide-8
SLIDE 8

Particulars Q1 FY19 Q2 FY19 Q3 FY19 Q4 FY19 FY19 FY18 Investment Activities Cash from Investment Activities(FD & MF) 2,026 798 997 1,195 5,017 4,081 Construction Cost-(CWIP/Capex Projects) (1,172) (1,677) (916) (1,562) (5,327) (6,017) Investment in Land/JD/JV/TDR (31) (52) (155) (714) (952) (4,355) Other Investments(FD & Mutual Fund) (1,058) (1,247) (467) (229) (3,001) (5,802) Net Cash Flow from Investment Activities(B) (235) (2,178) (541) (1,310) (4,264) (12,093) Financing Activities Debt Drawdown 1,922 3,518 2,843 2,882 11,165 20,125 Investment by PE 10 10 400 Proceeds from ESOP/QIP 3

  • 3

2 8 5,019 Dividend Payment

  • (319)
  • (319)

(358) Debt Repayment (1,992) (1,670) (2,245) (1,360) (7,267) (12,659) Interest Payment (676) (744) (788) (792) (3,000) (2,502) Net Cash Flow from Financing Activities( C ) (743) 785 (177) 732 597 10,025

Net Cash Flows for the Period( A+B+C) 12 278 (323) 869 837 (480)

CONSOLIDATED CASH FLOWS (2)

Amount in Rs. Mn

8

slide-9
SLIDE 9

DEPLOYMENT OF FUNDS – CONSOLIDATED – FY19

Figures as on Mar 2019; Amounts are in Rs. Mn

Seg Segment Equ quit ity (A (A) De Debt (B) (B) Cap Capit ital l Em Employed (A+B) (A+B) D/E /E Ra Ratio (A/B) (A/B) PBD BD / / Equ quity % Ope Operatin ing Cap Capit ital l Em Employed (OC (OCE) EBIT EBITDA / / OCE OCE % Real Estate 13,337 6,849 20,186 0.51 33% 20,186 27% Hospitality 3,536 5,202 8,738 1.47 11% 7,281 11% Lease Rental 11,396 21,344 32,740 1.87 8% 14,184 15% Less: Cash Balance 3,844 Tot

  • tal

28,269 29,551 61,664 1.05 20% 41,651 20% PBD = Profit Before Depreciation & Tax (After Interest)

9

Real Estate 33% Hospitality 14% Lease Rental 53%

Capital Employed

0% 10% 20% 30% 40% PBD/Equity % EBITDA/OCE % 33% 27% 11% 11% 8% 15%

Profitability Ratios

Real Estate Hospitality Lease Rental

slide-10
SLIDE 10

CONSOLIDATED DEBT PROFILE

10

Amount in Rs. Mn

Particulars Mar-19 Dec-18 Mar-18

  • 1. Real Estate

6,849 6,636 7,918

  • 2. Hospitality

GOP Securitised 3,319 3,312 3,376 Capex 1,883 1,464 971

  • 3. Leasing

Securitised Lease Rental 12,535 12,649 12,332 Capex 8,809 7,745 4,933 Less : Cash & Cash Equivalents 3,844 3,467 3,758 Net Debt 29,551 28,339 25,772 Less : SPV partner’s share of debt 4,848 4,334 3,014 Exposure of BEL 24,703 24,005 22,758 Cost of Debt (Consolidated) 9.63% 9.45% 9.21% Credit Rating CRISIL “A”; ICRA “A” CRISIL “A”; ICRA “A” CRISIL “A”; ICRA “A”

Note: The gross debt figure for Mar 2019 includes Rs. 9,847 Mn debt taken in SPVs where BEL has 4,999 Mn share

slide-11
SLIDE 11

BORROWING COST

11

Amount in Rs. Mn Average cost of borrowing has increased inline with the increase in MCLR of banks & FI’s by ~40 bps during the last 12 months.

8.0% 8.0% 8.0% 8.2% 8.3% 8.4% 8.5% 8.6% 9.8% 9.7% 9.3% 9.2% 9.2% 9.3% 9.5% 9.6%

JUN-17 SEP-17 DEC-17 MAR-18 JUN-18 SEP-18 DEC-18 MAR-19

Cost of Borrowing

SBI 1 Y MCLR Rate Brigade Cost of Debt

slide-12
SLIDE 12

GROUP SALES SNAPSHOT

12

Particulars FY19 FY18 FY19 on FY18 (% Inc) Q4 Q3 Q4 Q4 FY19 on Q3 FY19 Q4 FY19 on Q4 FY18 FY19 FY19 FY18 (% Inc) (% Inc) Area Sales ('000 sft) Residential 2,673 1,391 92% 863 744 353 16% 144% Commercial 292 175 67% 95 32 73 197% 30% Total 2,965 1,566 89% 958 776 426 23% 125% Sale Value (Rs. Mn) Residential 14,291 7,564 89% 4,637 4,224 1,763 10% 163% Commercial 2,149 1,399 54% 561 234 584 140%

  • 4%

Total 16,440 8,963 83% 5,198 4,458 2,347 17% 121% Realization (Rs.) 5,545 5,723

  • 3%

5,426 5,745 5,509

  • 6%
  • 2%
  • During FY19 area sold - 3 Mn sft and sale value of Rs. 16,440 Mn
  • Y-o-Y growth of 89% in area sold and 83% in total sales value for FY19
slide-13
SLIDE 13

SALES TREND

13

Sales Value (Rs. Mn)

12,490 9,555 8,964 16,440

2000 4000 6000 8000 10000 12000 14000 16000 18000 FY16 FY17 FY18 FY19

Y-o-Y Sales Value (Rs. Mn)

2,347 2,185 4,597 4,458 5,198

  • 1,000

2,000 3,000 4,000 5,000 6,000 Q4 FY18 Q1 FY19 Q2 FY19 Q3 FY19 Q4 FY19

Q-o-Q Sales Value (Rs. Mn)

Sales Area (‘000 sft)

2,249 1,626 1,566 2,965

500 1000 1500 2000 2500 3000 3500 FY16 FY17 FY18 FY19

Y-o-Y Sales Area (‘000 sft)

426 427 804 776 958

  • 200

400 600 800 1,000 1,200 Q4 FY18 Q1 FY19 Q2 FY19 Q3 FY19 Q4 FY19

Q-o-Q Sales Area (‘000 sft)

slide-14
SLIDE 14

ONGOING PROJECTS - SUMMARY

Area in ‘000 sft

* Through SPV

14

Projects Project Area LO/JV share Co Share Real Estate projects 8,994 1,808 7,186 Brigade Orchards * 1,567 783 784 Brigade Cornerstone Utopia* 2,363 792 1,571 Total Real Estate (A) 12,924 3,383 9,541 Brigade Orion OMR 268

  • 268

Brigade Tech Gardens* 3,200 1,568 1,632 WTC, Chennai* 2,000 980 1,020 Total Commercial (B) 5,468 2,548 2,920 Grand Mercure – GIFT City* 145

  • 145

Holiday Inn Express at Golden Triangle 88

  • 88

Ibis Style,Mysore* 110

  • 110

Total Hospitality (C) 343

  • 343

Total (A+B+C) 18,735 5,931 12,804

Real Estate 69% Lease Rental 29% Hospitality 2%

Total Project Area

Real Estate 74% Lease Rental 23% Hospitality 3%

Company Share Project Area

slide-15
SLIDE 15

CONSOLIDTAED SYNOPSIS OF REAL ESTATE PROJECTS

15

Particulars Ongoing BEL Projects Ongoing SPV Projects Stock Sales Total In Mn. Sft Total super built-up area of projects on sale basis 8.99 3.93 1.05 13.97 Less: LO Share 1.81 0.79

  • 2.60

Co share of saleable area 7.18 3.14 1.05 11.37 Sold till date 2.97 0.99

  • 3.96

To be sold 4.21 2.15 1.05 7.41

  • Rs. In Mn

Estimated Receipts 36,396 16,973 5,810 59,179 From Sold units 14,970 5,308

  • 20,278

From unsold units 21,425 11,665 5,810 38,900 Collection till date on sold units 8,715 2,655

  • 11,370

Balance collection for the projects (From Sold Units) 6,255 2,653

  • 8,908

Balance collection for the projects (sold and unsold units)-A 27,680 14,318 5,810 47,808 Estimated Total cost to be spent 27,465 13,106 4,400 44,971 Cost incurred till date 13,462 4,981 4,400 22,843 Balance Cost to be incurred to finish the project- B 14,005 8,125

  • 22,128

Gross Operating Cash Flows (A-B) 13,677 6,193 5,810 25,680 Present Borrowings – C 4,490 1,480 879 6,849 Net Operating Cash Flows projected (A-B-C) 9,187 4,713 4,931 18,831

slide-16
SLIDE 16

LEASE POSITION – MAR 2019

16

▪ Total operational leasable area is 3.29 Mn sft out of which 2.54 Mn sft is leased as on 31st March 2019 ▪ In addition, we have leased appx 0.6 Mn sft in Brigade Tech Garden and WTC Chennai which is yet to be

  • perational.

980 1,559 31 723

  • 300

600 900 1,200 1,500 1,800 2,100 2,400

Retail Office Leased out To be Leased

slide-17
SLIDE 17

HOSPITALITY BUSINESS FY19 PERFORMANCE- 1

17

GRAND MERCURE (BLR) SHERATON GRAND Details FY19 FY18 FY19 FY18 No of Keys 126 126 230 230 Occupancy 69% 71% 80% 77% ARR (Rs.) 7,039 6,898 8,237 8,434 GOP 38% 41% 42% 40% GOP (Rs. In Mn) 135 138 509 444

Sheraton GM (BLR)

slide-18
SLIDE 18

HOSPITALITY BUSINESS FY19 PERFORMANCE- 2

18

HOLIDAY INN CHENNAI HOLIDAY INN EXPRESS (BLR) Details FY19 FY18 FY19 Oct to Mar-18 No of Keys 202 202 272 272 Occupancy 72% 36% 45% 32% ARR (Rs.) 4,384 4,228 4,281 4,975 GOP 31% 6% 30% 7% GOP (Rs. In Mn) 121 13 66 3

Holiday Inn Chennai HIEX (BLR)

slide-19
SLIDE 19

HOSPITALITY BUSINESS FY19 PERFORMANCE- 3

19

GRAND MERCURE (MYSORE) Details FY19 FY18 No of Keys 146 146 Occupancy 56% 45% ARR (Rs.) 3,584 3,734 GOP 21% 9% GOP (Rs. In Mn) 40 14 Four Points by Sheraton, Kochi

  • pened in Jan-19 with 218 keys is the
  • nly 5 Star hotel situated within Kochi

Infopark which is spread over 101 acres, housing over 200 companies.

GM(Mysore

slide-20
SLIDE 20

HOSPITALITY BUSINESS FY19 PERFORMANCE- 4

20

Occupancy Rate Occupancy Rate

6,666 6,898 7,039 73% 71% 69%

50% 60% 70% 80%

6,400 6,500 6,600 6,700 6,800 6,900 7,000 7,100 FY 2017 FY 2018 FY 2019

Grand Mercure - Bangalore

ARR Occupance Rate

ARR in INR

7,638 8,434 8,237 81% 77% 80%

50% 60% 70% 80% 90%

7,000 7,500 8,000 8,500 FY 2017 FY 2018 FY 2019

Sheraton Grand- Bangalore

ARR Occupance Rate

ARR in INR Occupancy Rate

3,734 3,584 45% 56%

30% 40% 50% 60%

2,000 2,500 3,000 3,500 4,000 FY 2018 FY 2019

Grand Mercure - Mysore

ARR Occupance Rate

ARR in INR Occupancy Rate

4,228 4,384 36% 72%

20% 30% 40% 50% 60% 70% 80%

2,000 2,500 3,000 3,500 4,000 4,500 5,000 FY 2018 FY 2019

Holiday Inn Chennai

ARR Occupance Rate

ARR in INR

Holiday Inn Express has not been included since it started operations only from Oct-17.

slide-21
SLIDE 21

Bangalore Hyderabad Mangalore Mysore Kochi Chennai

LAND BANK - GROUP

* Includes Refundable/Non Refundable Deposits for Joint Developments

21

Location Land Area (in acres) Total Cost* (INR in Mn) Paid (INR in Mn) Payable (INR in Mn) Bangalore 284 10,333 8,211 2,122 Chennai 54 2,452 2,232 220 Hyderabad 13 180 120 60 Kochi 18 140 140 0- Mangalore 29 54 46 8 Gujarat 2 267 130 137 Mysore 17 20 12 8 Thiruvananthapuram 14 368 18 350 Grand Total 431 13,814 10,909 2,905

Bangalore 66% Chennai 13% Hyderabad 3% Kochi 4% Mangalore 7% Gujarat 0% Mysore 4% Thiruvananthapuram 3%

Land Area (Acres)

Thiruvananthapuram Gujarat

slide-22
SLIDE 22

LAND BANK – DEVELOPABLE AREA

Product Proj Area SFT in Mn BEL Share SFT in Mn Residential 32.1 23.4 Commercial-Sale 1.9 1.0 Commercial-Lease 10.9 10.4 Hotel 0.4 0.4 Total 45.3 35.2 Location Proj Area SFT in Mn BEL Share SFT in Mn Bangalore 32.4 25.6 Chennai 5.1 2.8 Hyderabad 1.7 1.1 Kochi 0.1 0.1 Mangalore 2.9 2.7 GIFT 0.3 0.3 Thiruvananthapuram 2.2 2.2 Mysore 0.6 0.4 Total 45.3 35.2

Bangalore 72% Chennai 11% Hyderabad 4% Kochi 0% Mangalore 6% GIFT 1% Thiruvananthapuram 5% Mysore 1%

Project Area - Location

Residential 71% Commercial-Sale 4% Commercial-Lease 24% Hotel 1%

Project Area - Product

slide-23
SLIDE 23

PROJECTS LAUNCHED IN FY19

Project Product City Project Area Launched Mn sft Qtr

  • 1. Brigade Enterprises Limited

Brigade Buena vista Ph II Residential Bangalore 0.50 Q1 Brigade Senate 1 Commercial-Sale Bangalore 0.17 Q2 Brigade Senate 2 Commercial -sale Bangalore 0.20 Q1 Brigade Woods Residential Bangalore 0.52 Q2 Brigade Bricklane Residential Bangalore 0.71 Q3 Brigade Parkside East Residential Bangalore 0.29 Q3 Brigade Parkside West Residential Bangalore 0.38 Q3 Brigade Parkside North Residential Bangalore 0.46 Q3 Brigade Utopia Serene Residential Bangalore 1.63 Q3 Brigade Utopia Eden Residential Bangalore 0.73 Q4 Total 5.59

  • 2. BCV Developers Private Limited

Arcade @ Orchards Commercial-Sale Bangalore 0.24 Q2 Total 0.24

23

slide-24
SLIDE 24

PROJECTS LAUNCHED IN FY19

24

PROJECTS TO BE LAUNCHED

Segment Total Area (mn sq ft) Brigade Economic Interest (mn sq ft) Residential 5.47 3.78 Commercial Sale 1.02 0.59 Leasing 2.00 2.00 Hospitality 0.11 0.11 Total 8.60 6.48 Project (Hospitality) City No of Keys

  • 3. Brigade Hotel Ventures Limited

Ibis Styles, Mysore Mysore 151 Keys

slide-25
SLIDE 25

Brigade Performance–FY19

Audit Committee & Board of Directors Meeting

May 7, 2019 (CIN: L85110KA1995PLC019126)

25

Annexure - Standalone Financials, CAPEX Commitment,

Awards.

Artist’s Impression: Brigade Tech Garden

slide-26
SLIDE 26

CAPEX COMMITMENT – COMMERCIAL

Amount in Rs. Mn

Proj

  • jects

Es

  • Est. cos
  • st

t Incu Incurred Bala Balance

  • 1. Brigade Enterprises Limited

A.Retail Space & Hotel Brigade Orion OMR & Holiday Inn Express* 1,935 749 1,186 Total Retail il Spa Space 1,935 749 1,186

26

As on Mar 2019

* Include HIEX with 134 keys

Proj

  • jects

Es

  • Est. cos
  • st

t Inc Incurred Bala Balance 2.Brookefields Real Estates And Projects Private Limited SEZ Office Space Brigade Tech Gardens # 11,300 5,514 5,786 3.Perungudi Real Estates Private Limited – Lease World Trade Centre, Chennai # 8,000 2,649 5,351 Total Co Commercia ial l (1+ (1+2+3) 21,235 8,912 12,323

# Through 51% SPV

slide-27
SLIDE 27

CAPEX COMMITMENT - HOSPITALITY

Amount in Rs. Mn Projects

  • Est. cost

Incurred Balance Planned No. of Keys Expected date of Commencement

  • 1. Brigade Hotel Ventures Limited

Ibis Styles, Gift City* 1,140 710 430 159 Q3 FY20 Ibis Styles Mysore* 730 155 575 151 Q1 FY21 Total Hospitality 1,870 865 1,005 310

* Through 100% SPV

27

As on Mar 2019

slide-28
SLIDE 28

STANDALONE (IND-AS) FINANCIALS - SNAPSHOT

Amount in Rs. Mn

28

Particulars FY 19 (IND AS 115) Q4 FY 19 (IND AS 115) Q3 FY 19 (IND AS 115) Q4 FY 19 on Q3 FY 19 FY 18* Q4 FY 18*

Turnover

19,286 4,951 4,652 6% 13,683 3,192

EBITDA

6,046 1,732 1,337 29% 5,042 1,281

Interest

1,778 490 448 9% 1,833 531

Profit after Int

4,268 1,242 889 40% 3,209 750

Depreciation

682 213 162 32% 691 185

PBT

3,586 1,029 727 41% 2,518 565

Tax

1,244 376 250 51% 713 132

PAT

2,342 653 477 37% 1,805 433

EBITDA/Revenue

31% 35% 29% 37% 40%

PBT/Revenue

19% 21% 16% 18% 18%

PAT/Revenue

12% 13% 10% 13% 14%

*Since there is a change in accounting method, the current year numbers as per AS-115 cannot be compared with previous year figures.

slide-29
SLIDE 29
slide-30
SLIDE 30

RETAIL ❖ Best Thematic Decoration - ET Now Global Awards for Retail Excellence ❖ Most Admired Shopping Centre of the year - ET Now Global Awards for Retail Excellence ❖ Shopping Mall of the Year -10th Annual Estate Awards ❖ Best Shopping Mall of the Year - UnBox Retail ❖ Food Court of the year- Restaurant Awards 2018, South India ❖ Best Facility Management- National Energy Management Awards ❖ Most Admired Shopping Centre of the year Metro (South)- India Shopping Centre Awards ❖ Orion Mall won the award "Shopping Mall of the Year - South" at India Retail Award 2019 by Franchise India. COMMERCIAL ❖ Nalapad Brigade Centre won Best Commercial Project (South Zone) by Realty Plus OTHERS ❖ SEEM National Energy Management Award 2017- OMG won in 2018. ❖ Ms. Nirupa Shankar was awarded the Women Entrepreneur of the Year - Retail at the Times Power Women 2019 Awards​

AWARDS & RECOGNITION

30

slide-31
SLIDE 31

COMPLETED PROJECTS

31

Brigade Exotica Brigade Signature Towers Brigade Opus

slide-32
SLIDE 32

COMPLETED PROJECTS

32

Brigade Lakefront

slide-33
SLIDE 33

ONGOING PROJECTS

33

Structures - All 3 Basements floor slabs are completed. GF slab to 11th floor slab are

  • completed. 12th floor

slab works are in progress. World Trade Center, Chennai Brigade Tech Garden

Artist’s impression Artist’s impression

slide-34
SLIDE 34

UPCOMING PROJECTS

34

Structures - All 3 Basements floor slabs are completed. GF slab to 11th floor slab are

  • completed. 12th floor

slab works are in progress. Brigade Residences @ WTC Chennai Brigade El Dorado

Artist’s impression Artist’s impression

slide-35
SLIDE 35