Energy Response of the Beta-spectrometer by Geant4 Monte Carlo - - PDF document

energy response of the beta spectrometer by geant4 monte
SMART_READER_LITE
LIVE PREVIEW

Energy Response of the Beta-spectrometer by Geant4 Monte Carlo - - PDF document

Transactions of the Korean Nuclear Society Virtual Spring Meeting July 9-10, 2020 Energy Response of the Beta-spectrometer by Geant4 Monte Carlo simulation Hyeon Min Lee a,b , Bo-Young Han a* , Gwang-Min Sun a , Jaegi Lee a and Yongmin Kim b a


slide-1
SLIDE 1

Energy Response of the Beta-spectrometer by Geant4 Monte Carlo simulation

Hyeon Min Lee a,b, Bo-Young Han a*, Gwang-Min Sun a, Jaegi Lee a and Yongmin Kim b

aNeutron and Radioisotope Application Research Division, Korea Atomic Energy Research Institute, Daejeon,

Republic of Korea

bDepartment of Radiological Science, Daegu Catholic University, Gyeongbuk, Republic of Korea *Corresponding author: byhan@kaeri.re.kr

  • 1. Introduction

This study intends to contribute to neutrino physics by experimentally measuring the anti-neutrino energy spectrum of 238U. The antineutrino energy spectrum can be determined by measuring the beta-ray energy

  • spectrum. It is hard to detect the beta-ray directly because

the gamma-ray background signal relatively high. By this reason, the beta-spectrometer usually consisted of the multi-wire chamber for the beta-ray counting and the plastic scintillation detector for the beta-ray energy

  • spectroscopy. The beta-spectrometer detects beta-ray

using a coincidence method, which selects signals that

  • nly occur simultaneously within a specific time using

timing logic for two signals. In this study, the energy responses of the beta-spectrometer were compared with the Geant4 Monte Carlo simulations. In addition, a simulation study was conducted with the beta-ray energy spectrum measurement of 137Cs and 207Bi calibration sources.

  • 2. Experiments
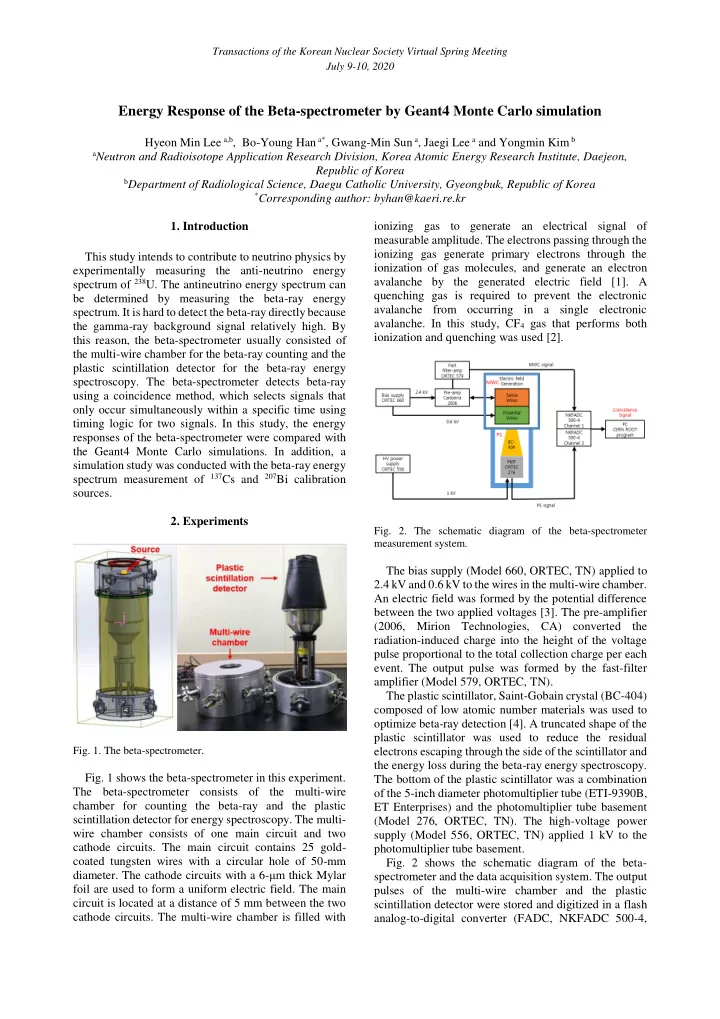
  • Fig. 1. The beta-spectrometer.
  • Fig. 1 shows the beta-spectrometer in this experiment.

The beta-spectrometer consists of the multi-wire chamber for counting the beta-ray and the plastic scintillation detector for energy spectroscopy. The multi- wire chamber consists of one main circuit and two cathode circuits. The main circuit contains 25 gold- coated tungsten wires with a circular hole of 50-mm

  • diameter. The cathode circuits with a 6-μm thick Mylar

foil are used to form a uniform electric field. The main circuit is located at a distance of 5 mm between the two cathode circuits. The multi-wire chamber is filled with ionizing gas to generate an electrical signal of measurable amplitude. The electrons passing through the ionizing gas generate primary electrons through the ionization of gas molecules, and generate an electron avalanche by the generated electric field [1]. A quenching gas is required to prevent the electronic avalanche from occurring in a single electronic

  • avalanche. In this study, CF4 gas that performs both

ionization and quenching was used [2].

  • Fig. 2. The schematic diagram of the beta-spectrometer

measurement system.

The bias supply (Model 660, ORTEC, TN) applied to 2.4 kV and 0.6 kV to the wires in the multi-wire chamber. An electric field was formed by the potential difference between the two applied voltages [3]. The pre-amplifier (2006, Mirion Technologies, CA) converted the radiation-induced charge into the height of the voltage pulse proportional to the total collection charge per each

  • event. The output pulse was formed by the fast-filter

amplifier (Model 579, ORTEC, TN). The plastic scintillator, Saint-Gobain crystal (BC-404) composed of low atomic number materials was used to

  • ptimize beta-ray detection [4]. A truncated shape of the

plastic scintillator was used to reduce the residual electrons escaping through the side of the scintillator and the energy loss during the beta-ray energy spectroscopy. The bottom of the plastic scintillator was a combination

  • f the 5-inch diameter photomultiplier tube (ETI-9390B,

ET Enterprises) and the photomultiplier tube basement (Model 276, ORTEC, TN). The high-voltage power supply (Model 556, ORTEC, TN) applied 1 kV to the photomultiplier tube basement.

  • Fig. 2 shows the schematic diagram of the beta-

spectrometer and the data acquisition system. The output pulses of the multi-wire chamber and the plastic scintillation detector were stored and digitized in a flash analog-to-digital converter (FADC, NKFADC 500-4,

Transactions of the Korean Nuclear Society Virtual Spring Meeting July 9-10, 2020

slide-2
SLIDE 2

Notice KOREA) with a sampling rate of 500 MHz. The two output pulses were simultaneously acquired within a specific time in the coincidence mode. The acquired signal was processed and analyzed using the data analysis framework ROOT [5].

137Cs (37 kBq, isotope products LAB) and 207Bi (102

kBq, RITVERC) calibration sources were used for energy calibration of the beta-spectrometer. 137Cs and

207Bi emit internal conversion (IC) electrons, which form

peaks in the energy spectrum [6]. The measured beta-ray energy spectra of the 137Cs and 207Bi sources are shown in Fig. 3, and the peaks formed by the IC electrons can be distinguished. The channels of the beta-spectrometer were calibrated by the peak energies of the two radioisotopes.

  • Fig. 3. The beta-ray energy spectra of 137Cs (left) and 207Bi

(right) sources. The x-axis is the area (charge quantity) of the signal.

  • 3. Geant4 Monte Carlo simulation

In this study, we tried to predict the response of the beta-spectrometer using the Geant4 Monte Carlo simulation [7], and perform energy calibration by comparing it with the measurement results. The beta-ray incident to the scintillator, the photon emission, and the reflection efficiency of the scintillator were depicted by the simulation. In order to evaluate the suitability of the plastic scintillator geometry, the energy loss according to the solid angle and the thickness of the plastic scintillator was observed for a single electron of 1 MeV at the source

  • position. When the beta-ray emitted from the source

passed through the edge of the plastic scintillation detector, it was confirmed that the energy resolution was lowered due to energy loss more than when passing through the center (Fig. 4 and 5). Therefore, in order to minimize the energy loss, it was necessary to use a collimator to measure only beta-ray incident to the center

  • f the plastic scintillation detector as much as possible.
  • Fig. 4. The electron energy spectra according to the solid angle

(blue line) and Gaussian fitting of the peaks (red line). The x- axis is the number of photons generated in the plastic scintillator corresponding to the energy. The y-axis is the intensity when the total area of the spectrum is 100.

  • Fig. 5. The energy resolution according to solid angle.

To see the effect on the thickness of the plastic scintillator, we compared and implemented the 50-mm, 100-mm and 150-mm thick plastic scintillator,

  • respectively. As a result, it was confirmed that the energy

resolution decreased as the plastic scintillator became thicker (Fig. 6 and 7).

  • Fig. 6. The electron energy spectra according to the plastic

scintillator thickness (blue line) and Gaussian fitting of the peaks (red line). The x-axis is the number of photons generated in the plastic scintillator corresponding to the energy. The y- axis is the intensity when the total area of the spectrum is 100.

  • Fig. 7. Energy resolution according to plastic scintillator

thickness. Transactions of the Korean Nuclear Society Virtual Spring Meeting July 9-10, 2020

slide-3
SLIDE 3

Finally, in order to secure the reliability of the beta-ray energy spectra obtained through experiments, a comparative study with simulation results was performed. The result of the first comparative study is shown in Fig.8.

  • Fig. 9 shows the result of the comparative study using the

energy resolution of the measurement results in the

  • simulation. It can be seen that the measurement spectra

and the simulation spectra in the low energy region do not match because the background events in the measurements were not sufficiently simulated. Therefore, further studies on background events are needed.

  • Fig. 8. Comparison of measurements (black dots) and

simulation calculations (blue line) before applying energy resolution.

  • Fig. 9. Comparison of measurements (black dots) and

simulation calculations (blue line) after applying energy resolution.

  • 4. Conclusion

In this study, the beta-spectrometer and data acquisition system were constructed to measure the beta- ray energy spectra. In order to evaluate the performance

  • f the beta-spectrometer, the results from the Geant4

Monte Carlo simulations were compared. The energy resolution was applied to the simulation for an accurate comparison, and it fit well in the peak area. The background events not sufficiently considered in the simulation will be further studied. Acknowledgement This work was supported by the National Research Foundation of Korea (NRF) Grant funded by the Korea government (MSIT) (NRF-2017M2A2A6A05018529). REFERENCES

[1] F. Sauli, "Principles of operation of multiwire proportional and drift chambers", CERN, Service d’Information scientifique, Genf, 1977. [2] A. Sharma, "Properties of some gas mixtures used in tracking detectors", GSI Darmstadt, SLAC-J-ICFA-16-3, 1998. [3] Saint Gobain crystals, Premium Plastic Scintillators, http://www.detectors.saint- gobain.com/uploadedFiles/SGdetectors/Documents/Product Data Sheets/BC400-404-408-412-416-Data-Sheet.pdf. [4] F. Sauli, Principles of operation of multiwire proportional and drift chambers, CERN, Service d’Information scientifique, Genf (1977). [5] R. Brun. F. Rademakers, “ROOT – an object oriented data analysis framework”, Nucl. Instrum. Meth. Phys. Res. A 389, 1997. [6] Nicholas Tsoulfanidis, “Measurement and Detection of Radiation”, Taylor & Francis, Washington DC, pp. 94-96, 1995. [7] S. Agostinelli et al., “Geant4-a simulation toolkit”, Nucl.

  • Instrum. Meth. Phys. Res. A 556, 2006.

Transactions of the Korean Nuclear Society Virtual Spring Meeting July 9-10, 2020