
SLIDE 1
!
- St. Louis
Epidemiology of Stuttering Attitudes Page 1 !
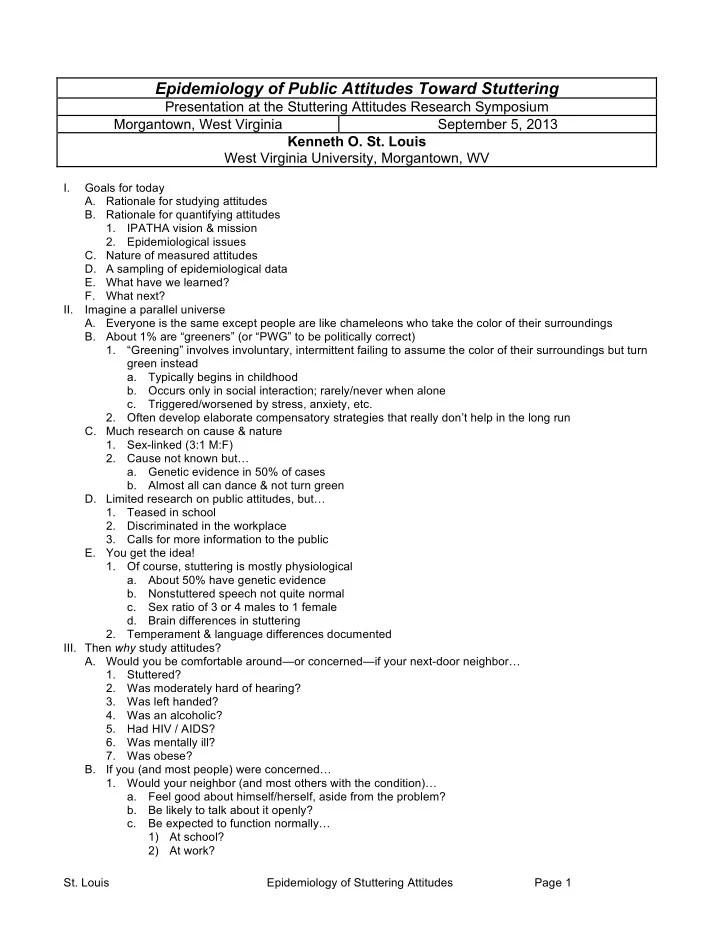
Epidemiology of Public Attitudes Toward Stuttering
Presentation at the Stuttering Attitudes Research Symposium Morgantown, West Virginia September 5, 2013 Kenneth O. St. Louis West Virginia University, Morgantown, WV
! I. Goals for today
- A. Rationale for studying attitudes
- B. Rationale for quantifying attitudes
- 1. IPATHA vision & mission
- 2. Epidemiological issues
- C. Nature of measured attitudes
- D. A sampling of epidemiological data
- E. What have we learned?
- F. What next?
- II. Imagine a parallel universe
- A. Everyone is the same except people are like chameleons who take the color of their surroundings
- B. About 1% are “greeners” (or “PWG” to be politically correct)
- 1. “Greening” involves involuntary, intermittent failing to assume the color of their surroundings but turn
green instead
- a. Typically begins in childhood
- b. Occurs only in social interaction; rarely/never when alone
- c. Triggered/worsened by stress, anxiety, etc.
- 2. Often develop elaborate compensatory strategies that really don’t help in the long run
- C. Much research on cause & nature
- 1. Sex-linked (3:1 M:F)
- 2. Cause not known but…
- a. Genetic evidence in 50% of cases
- b. Almost all can dance & not turn green
- D. Limited research on public attitudes, but…
- 1. Teased in school
- 2. Discriminated in the workplace
- 3. Calls for more information to the public
- E. You get the idea!
- 1. Of course, stuttering is mostly physiological
- a. About 50% have genetic evidence
- b. Nonstuttered speech not quite normal
- c. Sex ratio of 3 or 4 males to 1 female
- d. Brain differences in stuttering
- 2. Temperament & language differences documented
- III. Then why study attitudes?
- A. Would you be comfortable around—or concerned—if your next-door neighbor…
- 1. Stuttered?
- 2. Was moderately hard of hearing?
- 3. Was left handed?
- 4. Was an alcoholic?
- 5. Had HIV / AIDS?
- 6. Was mentally ill?
- 7. Was obese?
- B. If you (and most people) were concerned…
- 1. Would your neighbor (and most others with the condition)…
- a. Feel good about himself/herself, aside from the problem?
- b. Be likely to talk about it openly?
- c. Be expected to function normally…