SLIDE 5 2018-10-10 5
Massively Parallel Sequencing (N=95)
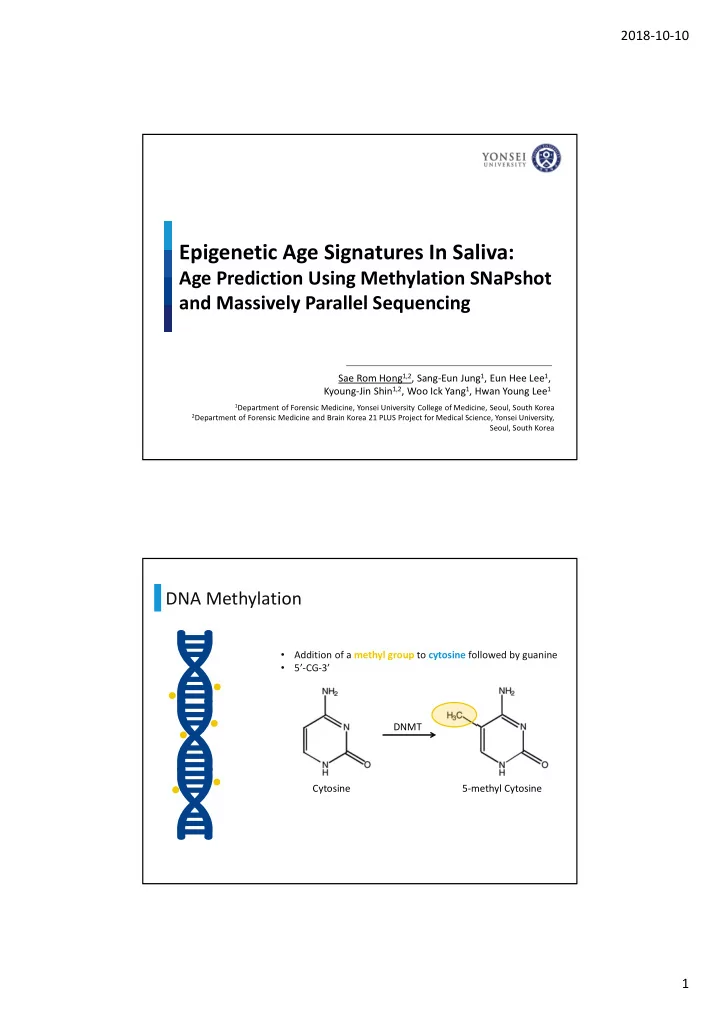
DNA Methylation Analysis
Multiplex PCR
Read Sequence
Indexing PCR
Index Sequence
Detail Workflow
10ng
Bisulfite conversed DNA Multiplex Methylation SNaPshot (N=226=95+131)
Multiplex PCR
DNA Methylation Analysis
Multiplex SBE
A G
Hong et al. FSI Genet. (2017) Lee et al. FSI Genet. (2016)
Methylation SNaPshot (N=95)
R² = 0.5412 0.1 0.2 0.3 0.4 20 40 60 80 Methylation Chronological Age (years)
cg00481951 (SST)
R² = 0.2541 0.1 0.2 0.3 0.4 20 40 60 80 Methylation Chronological Age (years)
cg19671120 (CNGA3)
R² = 0.6313 0.1 0.2 0.3 0.4 20 40 60 80 Methylation Chronological Age (years)
cg14361627 (KLF14)
R² = 0.4193 0.2 0.4 0.6 0.8 1 20 40 60 80 Methylation Chronological Age (years)
cg08928145 (TSSK6)
R² = 0.2139 0.1 0.2 0.3 0.4 0.5 0.6 20 40 60 80 Methylation Chronological Age (years)
cg12757011 (TBR1)
R² = 0.5928 0.1 0.2 0.3 0.4 0.5 0.6 20 40 60 80 Methylation Chronological Age (years)
cg07547549 (SLC12A5)
Methylation SNaPshot (N=226)
R² = 0.4791 0.1 0.2 0.3 0.4 20 40 60 80 Methylation Chronological Age (years)
cg00481951 (SST)
R² = 0.2882 0.1 0.2 0.3 0.4 20 40 60 80 Methylation Chronological Age (years)
cg19671120 (CNGA3)
R² = 0.6347 0.1 0.2 0.3 0.4 20 40 60 80 Methylation Chronological Age (years)
cg14361627 (KLF14)
R² = 0.4341 0.2 0.4 0.6 0.8 1 20 40 60 80 Methylation Chronological Age (years)
cg08928145 (TSSK6)
R² = 0.167 0.1 0.2 0.3 0.4 0.5 0.6 20 40 60 80 Methylation Chronological Age (years)
cg12757011 (TBR1)
R² = 0.5486 0.1 0.2 0.3 0.4 0.5 0.6 20 40 60 80 Methylation Chronological Age (years)
cg07547549 (SLC12A5)