Evaluating classifiers CS440 The 2-by-2 contingency table correct - - PDF document

evaluating classifiers
SMART_READER_LITE
LIVE PREVIEW

Evaluating classifiers CS440 The 2-by-2 contingency table correct - - PDF document

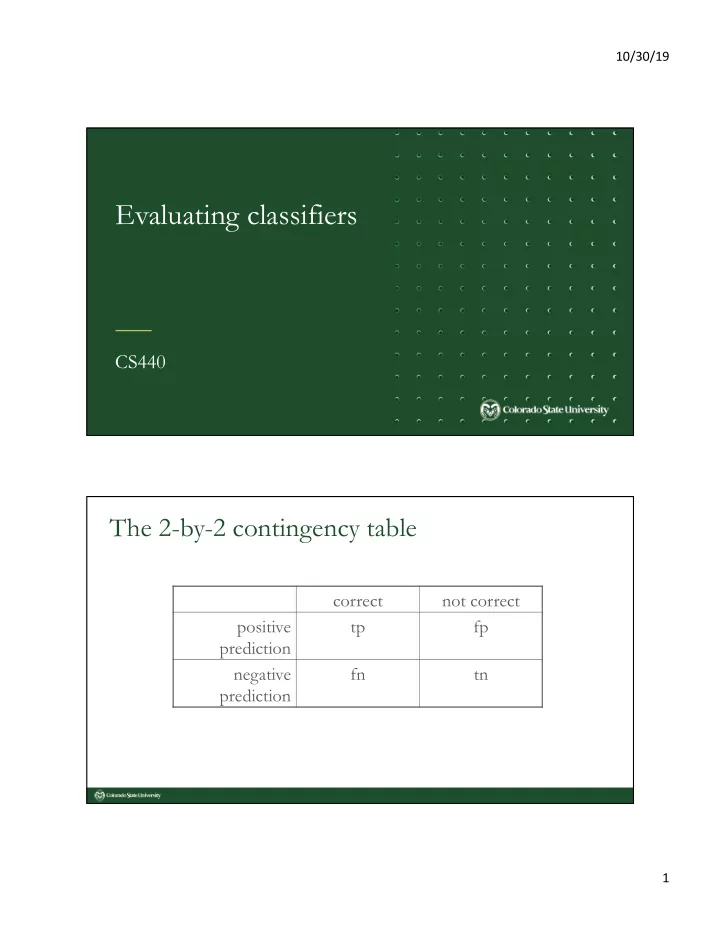
10/30/19 Evaluating classifiers CS440 The 2-by-2 contingency table correct not correct positive tp fp prediction negative fn tn prediction 1 10/30/19 Precision and recall Precision : % of predicted items that are correct P = tp/


slide-1
SLIDE 1

10/30/19 1

Evaluating classifiers

CS440

The 2-by-2 contingency table

correct not correct positive prediction tp fp negative prediction fn tn

slide-2
SLIDE 2

10/30/19 2

Precision and recall

  • Precision: % of predicted items that are correct P = tp/ (tp + fp)
  • Recall: % of correct items that are predicted R = tp / (tp + fn)

correct not correct positive prediction tp fp negative prediction fn tn

Combining precision and recall with the F measure

  • A combined measure that assesses the P/R tradeoff is F measure (weighted

harmonic mean):

  • The harmonic mean is a very conservative average (tends towards the

minimum)

  • People usually use the F1 measure

– i.e., with β = 1 (that is, α = ½): – F1 = 2PR/(P+R)

R P PR R P F + + = − + =

2 2

) 1 ( 1 ) 1 ( 1 1 β β α α

slide-3
SLIDE 3

10/30/19 3

Prediction problems with more than two classes

  • Dealing with muti-class problems

– A document can belong one of several classes.

  • Given test doc d,

– Evaluate it for membership in each class – d belongs to the class which has the maximum score

Sec.14.5

Prediction problems with more than two classes

  • Dealing with muti-label problems

– A document can belong to 0, 1, or >1 classes.

  • Given test doc d,

– Evaluate it for membership in each class – d belongs to any class for which the score is higher than some threshold

Sec.14.5

slide-4
SLIDE 4

10/30/19 4

  • Most (over)used data set, 21,578 docs (each 90 types, 200 toknens)
  • 9603 training, 3299 test articles (ModApte/Lewis split)
  • 118 categories

– An article can be in more than one category – Learn 118 binary category distinctions

  • Each document has 1.24 classes on average
  • Only about 10 out of 118 categories are large

Common categories (#train, #test)

Evaluation: the Reuters-21578 Data Set

  • Earn (2877, 1087)
  • Acquisitions (1650, 179)
  • Money-fx (538, 179)
  • Grain (433, 149)
  • Crude (389, 189)
  • Trade (369,119)
  • Interest (347, 131)
  • Ship (197, 89)
  • Wheat (212, 71)
  • Corn (182, 56)
  • Sec. 15.2.4

Reuters-21578 example document

<REUTERS TOPICS="YES" LEWISSPLIT="TRAIN" CGISPLIT="TRAINING-SET" OLDID="12981" NEWID="798"> <DATE> 2-MAR-1987 16:51:43.42</DATE> <TOPICS><D>livestock</D><D>hog</D></TOPICS> <TITLE>AMERICAN PORK CONGRESS KICKS OFF TOMORROW</TITLE> <DATELINE> CHICAGO, March 2 - </DATELINE><BODY>The American Pork Congress kicks off tomorrow, March 3, in Indianapolis with 160 of the nations pork producers from 44 member states determining industry positions

  • n a number of issues, according to the National Pork Producers Council, NPPC.

Delegates to the three day Congress will be considering 26 resolutions concerning various issues, including the future direction of farm policy and the tax law as it applies to the agriculture sector. The delegates will also debate whether to endorse concepts of a national PRV (pseudorabies virus) control and eradication program, the NPPC said. A large trade show, in conjunction with the congress, will feature the latest in technology in all areas of the industry, the NPPC added. Reuter &#3;</BODY></TEXT></REUTERS>

  • Sec. 15.2.4
slide-5
SLIDE 5

10/30/19 5

Confusion matrix

  • For each pair of classes <c1,c2> how many documents from c1 were

assigned to c2?

Docs in test set Assigned UK Assigned poultry Assigned wheat Assigned coffee Assigned interest Assigned trade True UK 95 1 13 1 True poultry 1 True wheat 10 90 1 True coffee 34 3 7 True interest 1 2 13 26 5 True trade 2 14 5 10

Per class evaluation measures

Recall: Fraction of documentss in class i classified correctly Precision:

Fraction of documents assigned class i that are actually

about class i Accuracy: (1 - error rate) Fraction of docs classified correctly

cii

i

cij

i

j

cii cji

j

cii cij

j

  • Sec. 15.2.4
slide-6
SLIDE 6

10/30/19 6

Micro- vs. Macro-Averaging

If we have two or more classes, how do we combine multiple performance measures into one quantity?

  • Macroaveraging: Compute performance for each class,

then average.

  • Microaveraging: Collect decisions for all classes,

compute contingency table, evaluate.

  • Sec. 15.2.4

12

Micro- vs. Macro-Averaging: Example

Truth: yes Truth: no Classifier: yes 10 10 Classifier: no 10 970 Truth: yes Truth: no Classifier: yes 90 10 Classifier: no 10 890 Truth: yes Truth: no Classifier: yes 100 20 Classifier: no 20 1860

Class 1 Class 2 Micro Ave. Table

  • Sec. 15.2.4
  • Macroaveraged precision: (0.5 + 0.9)/2 = 0.7
  • Microaveraged precision: 100/120 = .83
  • Microaveraged score is dominated by score on common classes
slide-7
SLIDE 7

10/30/19 7

Validation sets and cross-validation

  • Metric: P/R/F1 or Accuracy
  • Unseen test set

– avoid overfitting (‘tuning to the test set’) – more realistic estimate of performance

Cross-validation over multiple splits

– Pool results over each split – Compute pooled validation set performance

Training Set ValidaGon Set Test Set Test Set Training Set Training Set Val Set Training Set Val Set Val Set

The Real World

  • Gee, I’m building a text classifier for real, now!
  • What should I do?
  • Sec. 15.3.1
slide-8
SLIDE 8

10/30/19 8

No training data? Manually written rules

If (wheat or grain) and not (whole or bread) then Categorize as grain

  • Need careful crafting

– Human tuning on development data – Time-consuming

  • Sec. 15.3.1

Very little data?

  • Use Naïve Bayes
  • Get more labeled data

– Find clever ways to get humans to label data for you

  • Try semi-supervised training methods
  • Sec. 15.3.1
slide-9
SLIDE 9

10/30/19 9

A reasonable amount of data?

  • Perfect for all the clever classifiers

– SVM – Regularized Logistic Regression – Random forests and boosting classifiers – Deep neural networks

  • Look into decision trees

– Considered a more interpretable classifier

  • Sec. 15.3.1

A huge amount of data?

  • Can achieve high accuracy!
  • At a cost:

– SVMs/deep neural networks (train time) or kNN (test time) can be too slow – Regularized logistic regression can be somewhat better

  • So Naïve Bayes can come back into its own again!
  • Sec. 15.3.1
slide-10
SLIDE 10

10/30/19 10

Accuracy as a function of dataset size

  • Classification accuracy

improves with amount of data

  • Sec. 15.3.1

Brill and Banko on spelling correcGon

Real-world systems generally combine:

  • Automatic classification
  • Manual review of uncertain/difficult cases
slide-11
SLIDE 11

10/30/19 11

How to tweak performance

  • Domain-specific features and weights: very important in real performance
  • Sometimes need to collapse terms:

– Part numbers, chemical formulas, … – But stemming generally doesn’t help

  • Upweighting: Counting a word as if it occurred twice:

– title words (Cohen & Singer 1996) – first sentence of each paragraph (Murata, 1999) – In sentences that contain title words (Ko et al, 2002)

  • Sec. 15.3.2