
SLIDE 1
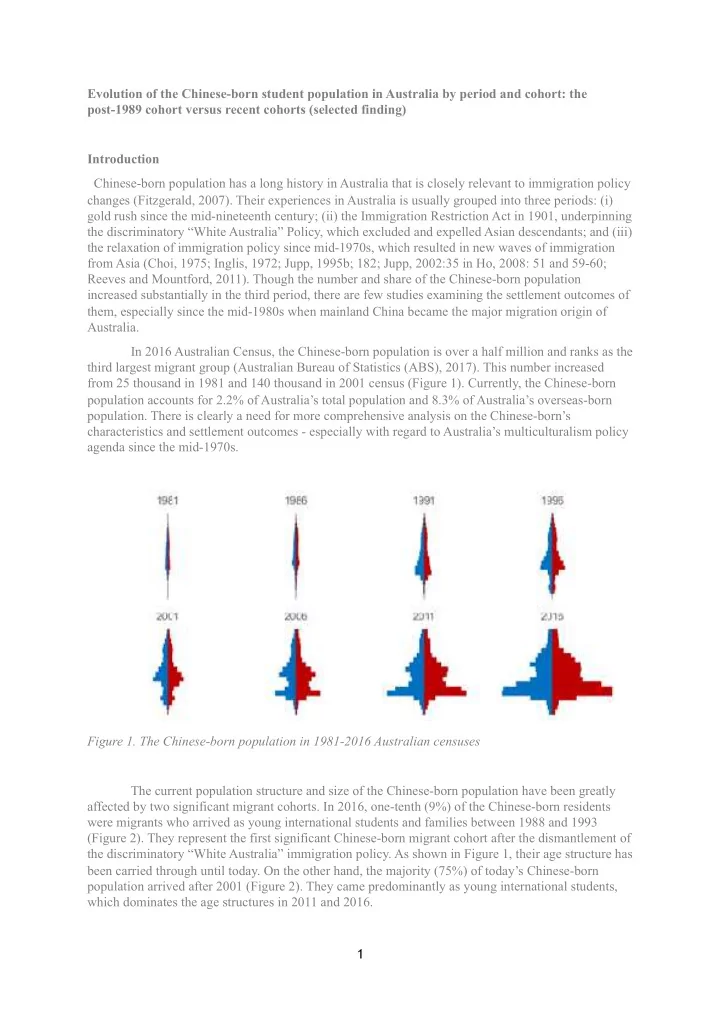
Evolution of the Chinese-born student population in Australia by period and cohort: the post-1989 cohort versus recent cohorts (selected finding) Introduction Chinese-born population has a long history in Australia that is closely relevant to immigration policy changes (Fitzgerald, 2007). Their experiences in Australia is usually grouped into three periods: (i) gold rush since the mid-nineteenth century; (ii) the Immigration Restriction Act in 1901, underpinning the discriminatory “White Australia” Policy, which excluded and expelled Asian descendants; and (iii) the relaxation of immigration policy since mid-1970s, which resulted in new waves of immigration from Asia (Choi, 1975; Inglis, 1972; Jupp, 1995b; 182; Jupp, 2002:35 in Ho, 2008: 51 and 59-60; Reeves and Mountford, 2011). Though the number and share of the Chinese-born population increased substantially in the third period, there are few studies examining the settlement outcomes of them, especially since the mid-1980s when mainland China became the major migration origin of Australia. In 2016 Australian Census, the Chinese-born population is over a half million and ranks as the third largest migrant group (Australian Bureau of Statistics (ABS), 2017). This number increased from 25 thousand in 1981 and 140 thousand in 2001 census (Figure 1). Currently, the Chinese-born population accounts for 2.2% of Australia’s total population and 8.3% of Australia’s overseas-born
- population. There is clearly a need for more comprehensive analysis on the Chinese-born’s
characteristics and settlement outcomes - especially with regard to Australia’s multiculturalism policy agenda since the mid-1970s.
- Figure 1. The Chinese-born population in 1981-2016 Australian censuses