Exploring Incentives and Implications of Adverse Selection in Dairy - - PDF document

exploring incentives and implications of adverse
SMART_READER_LITE
LIVE PREVIEW

Exploring Incentives and Implications of Adverse Selection in Dairy - - PDF document

Exploring Incentives and Implications of Adverse Selection in Dairy Margin Insurance John Newton, Ph.D. Candidate 20th Annual National Workshop for Dairy Economists and Policy Analysts The Ohio State University Advisor: Dr. Cameron S. Thraen 1


slide-1
SLIDE 1

Exploring Incentives and Implications of Adverse Selection in Dairy Margin Insurance

John Newton, Ph.D. Candidate

20th Annual National Workshop for Dairy Economists and Policy Analysts The Ohio State University Advisor: Dr. Cameron S. Thraen 1 newton.276@osu.edu

May 13, 2013

1Funding for this research is provided, in part, by the Ohio Agricultural Research and Development Center, The Ohio State University. Research presented is part of a larger dissertation effort: ”Policy Options for Managing Risk in a Modern Dairy Economy.”

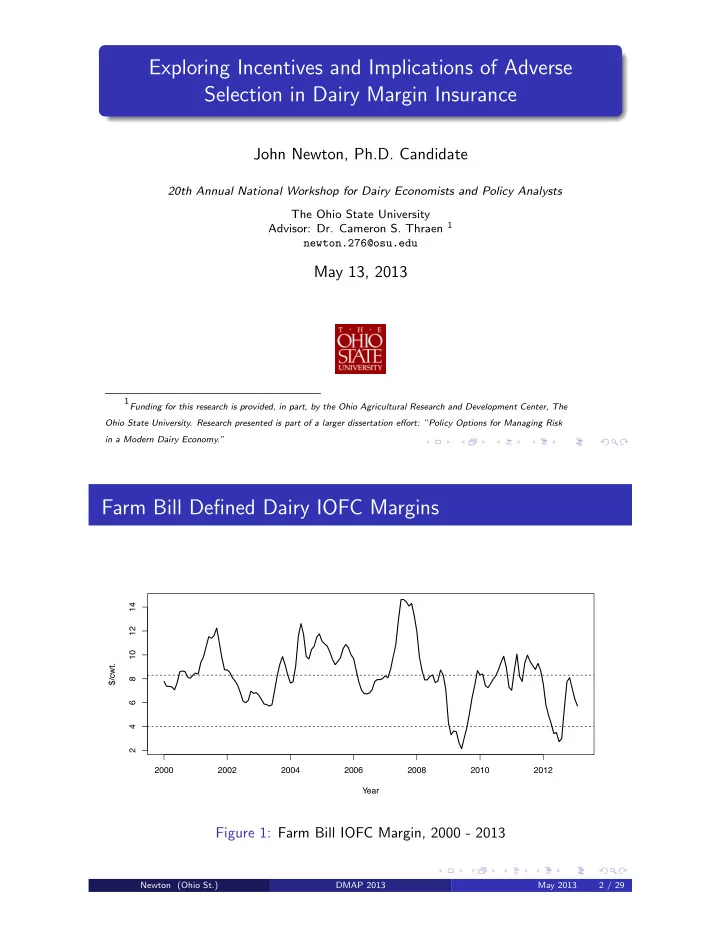
Farm Bill Defined Dairy IOFC Margins

2000 2002 2004 2006 2008 2010 2012 2 4 6 8 10 12 14 Year $/cwt.

Figure 1: Farm Bill IOFC Margin, 2000 - 2013

Newton (Ohio St.) DMAP 2013 May 2013 2 / 29

slide-2
SLIDE 2

Adverse Selection

The demand for insurance is positively correlated with the risk of loss, and the insurer is unable to factor this correlation in the insurance premium Producers are better informed about potential benefits and thus better able to assess the actuarial fairness of the premiums than the insurer Expected benefits from insurance (i.e. indemnity minus DMSP foregone revenue if applicable) should be equal to the non-subsidized premium Premiums for dairy margin insurance are fixed and only vary with respect to the insurance coverage level and farm milk production (do not consider risk environment)

Newton (Ohio St.) DMAP 2013 May 2013 3 / 29

Implications of Fixed Premiums on Flood Insurance

Figure 2: Low Risk of Flood Figure 3: Water is at Your Knees!

Would you charge the same price to insure against a flood... when the house is located in a flood plain?

Newton (Ohio St.) DMAP 2013 May 2013 4 / 29

slide-3
SLIDE 3

Implications of Fixed Premiums on Fire Insurance

Figure 4: Low Risk of Fire Figure 5: House is on Fire!

Would you charge both homeowners the same price to insure against a fire... when you see smoke coming from the attic?

Newton (Ohio St.) DMAP 2013 May 2013 5 / 29

Implications of Fixed Premiums on Margin Insurance

Figure 6: Low Indemnity Probability

2 4 6 8 10 12 14 J F M A M J J A S O N D $/cwt

Income-Over-Feed-Cost Margin

Figure 7: High Indemnity Probability

2 4 6 8 10 12 14 J F M A M J J A S O N D $/cwt

Income-Over-Feed-Cost Margin

Would you charge the same price to insure an $8.00 IOFC margin... when CME markets indicate an imminent catastrophic margin?

Newton (Ohio St.) DMAP 2013 May 2013 6 / 29

slide-4
SLIDE 4

Research Motivation

The dairy margin insurance program was originally intended to lock-in a producer to a coverage level for 5 years Margin insurance premiums reflected the 5 year commitment and were likely close to actuarially fair (given some level of subsidization) Modifications to the margin insurance program now allow for annual supplemental coverage decisions Yet...the fixed premiums remain unchanged and range from $0 per cwt for the lowest coverage to $1.06 per cwt for maximum coverage This is in stark contrast from exchange traded instruments whose prices change continuously to reflect new market information

Newton (Ohio St.) DMAP 2013 May 2013 7 / 29

A Cause for Concern and Rejoice

With fixed insurance premiums the timing of the insurance decision is critical as the risk environment is not static Decisions made near the coverage start date induce severe adverse selection incentives (more information on risk environment)

When the probability of indemnity payments is high, producers who recognize that their expected benefits exceed their premiums are more likely to buy supplemental insurance coverage When the risk environment is low, producers who recognize that their expected benefits are less than their expected premiums are less likely to buy supplemental insurance coverage

Earlier decisions reduce this incentive and may even allow for lower insurance premiums

Newton (Ohio St.) DMAP 2013 May 2013 8 / 29

slide-5
SLIDE 5

“Strong” Adverse Selection Incentives

Decision in January & begins in January Feed stock information is known, milk price uncertainty is diminished in nearby months (formula pricing)

Newton (Ohio St.) DMAP 2013 May 2013 9 / 29

“Strong” Adverse Selection Incentives

Decision in January & begins in January

“Moderate” Adverse Selection Incentives

Decision in October & begins in January

Months

Feed stock information is known, milk price uncertainty is diminished in nearby months (formula pricing) Harvest information is known, milk price uncertainty remains Newton (Ohio St.) DMAP 2013 May 2013 10 / 29

slide-6
SLIDE 6

“Strong” Adverse Selection Incentives

Decision in January & begins in January

“Moderate” Adverse Selection Incentives

Decision in October & begins in January

Months

“Weak” Adverse Selection Incentives

Decision in March & begins in October

Months

Feed stock information is known, milk price uncertainty is diminished in nearby months (formula pricing) Harvest information is known, milk price uncertainty remains Milk and feed prices are uncertain (Prospective Plantings Report in March) Newton (Ohio St.) DMAP 2013 May 2013 11 / 29

Weak Adverse Selection...18-Month Look Ahead

Exhibit A Exhibit B

2 4 6 8 10 12 14 J F M A M J J A S $/cwt 2 4 6 8 10 12 14 J F M A M J J A S $/cwt 2 4 6 8 10 12 14 J F M A M J J A S $/cwt

Exhibit C

2 4 6 8 10 12 14 J F M A M J J A S $/cwt

Exhibit D

Newton (Ohio St.) DMAP 2013 May 2013 12 / 29

slide-7
SLIDE 7

Moderate Adverse Selection...15-Month Look Ahead

Exhibit A Exhibit B

2 4 6 8 10 12 14 J F M A M J J A S O N D $/cwt 2 4 6 8 10 12 14 J F M A M J J A S O N D $/cwt 2 4 6 8 10 12 14 J F M A M J J A S O N D $/cwt

Exhibit C

2 4 6 8 10 12 14 J F M A M J J A S O N D $/cwt

Exhibit D

Newton (Ohio St.) DMAP 2013 May 2013 13 / 29

Strong Adverse Selection...12-Month Look Ahead

A: Catastrophic B: Mean Reverting

2 4 6 8 10 12 14 J F M A M J J A S O N D $/cwt 2 4 6 8 10 12 14 J F M A M J J A S O N D $/cwt 2 4 6 8 10 12 14 J F M A M J J A S O N D $/cwt

C: Long-Run Average

2 4 6 8 10 12 14 J F M A M J J A S O N D $/cwt

D: 2013 IOFC Margin

Newton (Ohio St.) DMAP 2013 May 2013 14 / 29

slide-8
SLIDE 8

Empirical Illustration

Using a representative farm (approx. 360 cows) Monte-Carlo experiments were used to estimate net benefits of participation for selected margin scenarios Dairy Security Act DMSP price boost DMSP foregone revenue Indemnity Participation fees Dairy Freedom Act DMSP price boost DMSP foregone revenue Indemnity Participation fees

Newton (Ohio St.) DMAP 2013 May 2013 15 / 29

Select Results of Dairy Freedom Act (12 v. 15 Months)

Table 1: Net Expected Benefits for Select Coverage Levels Decision 12 Month 15 Month Scenario $4.00 $7.00 $8.00 $4.00 $7.00 $8.00 Cost 1,196 20,906 72,649 1,196 20,906 72,649 Catastrophic 16,228 120,273 127,845

  • 272

437

  • 27,337

Mean-Revert’g 467 5,944

  • 21,280
  • 1,070
  • 14,449
  • 55,552

Long-Run

  • 1,153
  • 16,146
  • 57,242
  • 882
  • 4,368
  • 32,102

Jan 15, 2013 1,985 41,947 40,710 7,538 53,183 46,733

Notes: Production History (Annual): 89,821. Supplemental coverage percentage 80%. Net expected benefits for the Dairy Freedom Act include expected indemnities less program premiums. Newton (Ohio St.) DMAP 2013 May 2013 16 / 29

slide-9
SLIDE 9

Select Results of Dairy Freedom Act (12 v. 15 Months)

Table 2: Net Expected Benefits for Select Coverage Levels Decision 12 Month 15 Month Scenario $4.00 $7.00 $8.00 $4.00 $7.00 $8.00 Cost 1,196 20,906 72,649 1,196 20,906 72,649 Catastrophic 16,228 120,273 127,845

  • 272

437

  • 27,337

Mean-Revert’g 467 5,944

  • 21,280
  • 1,070
  • 14,449
  • 55,552

Long-Run

  • 1,153
  • 16,146
  • 57,242
  • 882
  • 4,368
  • 32,102

Jan 15, 2013 1,985 41,947 40,710 7,538 53,183 46,733

Notes: Production History (Annual): 89,821. Supplemental coverage percentage 80%. Net expected benefits for the Dairy Freedom Act include expected indemnities less program premiums. Newton (Ohio St.) DMAP 2013 May 2013 17 / 29

Select Results of Dairy Freedom Act (12 v. 18 Months)

Table 3: Net Expected Benefits for Select Coverage Levels Decision 12 Month 18 Month Scenario $4.00 $7.00 $8.00 $4.00 $7.00 $8.00 Cost 1,196 20,906 72,649 1,190 20,835 72,452 Catastrophic 16,228 120,273 127,845

  • 806

3,214

  • 17,995

Mean-Revert’g 467 5,944

  • 21,280
  • 1,162
  • 10,445
  • 40,444

Long-Run

  • 1,153
  • 16,146
  • 57,242
  • 328

1,738

  • 22,322

Jan 15, 2013 1,985 41,947 40,710 4,952 60,975 61,056

Notes: Production History based on fiscal year: 89,590 cwt for 18 month example only. Supplemental coverage percentage 80%. Net expected benefits for the Dairy Freedom Act include expected indemnities less program premiums. Newton (Ohio St.) DMAP 2013 May 2013 18 / 29

slide-10
SLIDE 10

Select Results of Dairy Security Act (12 v. 15 Months)

Table 4: Net Expected Benefits for Select Coverage Levels Decision 12 Month 15 Month Scenario $4.00 $6.50 $8.00 $4.00 $6.50 $8.00 Cost 250 13,803 74,784 250 13,803 74,784 Catastrophic

  • 962

89,854 124,552

  • 1,368
  • 911
  • 26,739

Mean-Revert’g

  • 1,242

3,605

  • 20,677
  • 555
  • 10,173
  • 56,125

Long-Run

  • 469
  • 11,321
  • 57,812
  • 1,182
  • 4,483
  • 31,009

Jan 15, 2013

  • 5,587

22,454 40,322

  • 2,108

35,135 44,424

Notes: Production History (Annual): 89,821. Supplemental coverage percentage 90%. DMSP price boost based on low impact parameterization with elasticity of -0.4 and participate of 25%. Net expected benefits for the Dairy Security Act include expected indemnities less program premiums, administration fees, and DMSP foregone revenue. DMSP price enhancement benefits are considered free-rider benefits. Newton (Ohio St.) DMAP 2013 May 2013 19 / 29

Select Results of Dairy Security Act (12 v. 18 Months)

Table 5: Net Expected Benefits for Select Coverage Levels Decision 12 Month 18 Month Scenario $4.00 $6.50 $8.00 $4.00 $6.50 $8.00 Cost 250 13,803 74,784 250 13,755 74,591 Catastrophic

  • 962

89,854 124,552

  • 2,110
  • 257
  • 16,645

Mean-Revert’g

  • 1,242

3,605

  • 20,677
  • 1,412
  • 9,325
  • 40,051

Long-Run

  • 469
  • 11,321
  • 57,812
  • 2,165
  • 1,304
  • 21,915

Jan 15, 2013

  • 5,587

22,454 40,322

  • 6,245

38,511 58,880

Notes: Production History based on fiscal year: 89,590 cwt for 18 month example only. Supplemental coverage percentage 90%. DMSP price boost based on low impact parameterization with elasticity of -0.4 and participate of 25%. Net expected benefits for the Dairy Security Act include expected indemnities less program premiums, administration fees, and DMSP foregone

  • revenue. DMSP price enhancement benefits are considered free-rider benefits.

Newton (Ohio St.) DMAP 2013 May 2013 20 / 29

slide-11
SLIDE 11

Can We Reduce Premiums with Earlier Decisions?

Table 6: Sample of Expected Benefits Per Cwt. Dairy Freedom Act

Decision Catastrophic Long Run Jan 15 2013 Scenario $7.00 $8.00 $7.00 $8.00 $7.00 $8.00 Cost ≤ 4M 0.180 0.950 Cost > 4M 0.380 1.060 Zero Gap 1.541 2.188 0.052 0.168 0.686 1.237 3-Month Gap 0.233 0.495 0.181 0.443 0.808 1.303 6-Month Gap 0.264 0.597 0.248 0.550 0.897 1.464

Note: Expected benefits for the Dairy Freedom Act include expected indemnities. Newton (Ohio St.) DMAP 2013 May 2013 21 / 29

Can We Reduce Premiums with Earlier Decisions?

Table 7: Sample of Expected Benefits Per Cwt. Dairy Freedom Act

Decision Catastrophic Long Run Jan 15 2013 Scenario $7.00 $8.00 $7.00 $8.00 $7.00 $8.00 Cost ≤ 4M 0.180 0.950 Cost > 4M 0.380 1.060 Zero Gap 1.541 2.188 0.052 0.168 0.686 1.237 3-Month Gap 0.233 0.495 0.181 0.443 0.808 1.303 6-Month Gap 0.264 0.597 0.248 0.550 0.897 1.464

Note: Expected benefits for the Dairy Freedom Act include expected indemnities. Newton (Ohio St.) DMAP 2013 May 2013 22 / 29

slide-12
SLIDE 12

Can We Reduce Premiums with Earlier Decisions?

Table 8: Sample of Expected Benefits Per Cwt. Dairy Security Act

Decision Catastrophic Long Run Jan 15 2013 Scenario $6.50 $8.00 $6.50 $8.00 $6.50 $8.00 Cost ≤ 4M 0.090 0.922 Cost > 4M 0.230 0.922 Zero Gap 1.131 2.176 0.027 0.185 0.396 1.256 3-Month Gap 0.141 0.524 0.102 0.478 0.534 1.301 6-Month Gap 0.148 0.636 0.137 0.578 0.573 1.464

Notes: Expected benefits for the Dairy Security Act include expected indemnities less DMSP foregone revenue. Low Impact Parameterization. Newton (Ohio St.) DMAP 2013 May 2013 23 / 29

Considerations

Nearby decisions have strong adverse selections incentives and may lead to windfall indemnity payments during low-margin outcomes (Government is 100% liable) Government may not be compensated for holding risk and thus unable to build necessary reserves to fund indemnities With longer decision intervals the ability to capitalize on imminent low margins is reduced If the decision point is earlier margin insurance premiums may be reduced as farmer holds additional risk (more research needed) observed single period reductions of 40-50%

Newton (Ohio St.) DMAP 2013 May 2013 24 / 29

slide-13
SLIDE 13

Questions/Comments

email: newton.276@osu.edu

Newton (Ohio St.) DMAP 2013 May 2013 25 / 29

Technical Appendix

Newton (Ohio St.) DMAP 2013 May 2013 26 / 29

slide-14
SLIDE 14

Methodology to Assess Contract Fairness

First, forecast dairy IOFC margins using CME futures and options prices

Log-normal price distributions are generated for each commodity and time horizon Data on futures price deviates are used to estimate conditional rank correlations The marginal distributions of milk and feed are joined together to preserve milk and feed price co-movement

Second, introduce structural parameters on dairy supply and demand to shock milk prices following DMSP announcement Then Monte-Carlo experiments are used to determine expected benefits of participation to compare against program premiums

Newton (Ohio St.) DMAP 2013 May 2013 27 / 29

Determining the Net Benefits (DSA)

Assuming no production changes, in the presence of insurance the utility of net benefits is given by: X

zn∈Z

π(zn)U[φF(·)(p∗(zn) − p(zn)) | {z }

DMSP Price Boost

+I(·) − q(·) − φp∗(zn)y∗ | {z }

DMSP Penalty

] Benefits are equal to DMSP price boost, plus the indemnity, less premiums and DMSP penalty Indemnity I(zn, c, Y ) includes expected prices, insurance coverage level, and milk production Premium q(Y (L), c) does not include expected prices

Newton (Ohio St.) DMAP 2013 May 2013 28 / 29

slide-15
SLIDE 15

Determining the Net Benefits (DFA)

Assuming no production changes, in the presence of insurance the utility of net benefits is given by: X

zn∈Z

π(zn)U[I(·) − q(·)] Benefits are equal to the indemnity less premiums Indemnity I(zn, c, Y ) includes expected prices, insurance coverage level, and milk production Premium q(Y (L), c) does not include expected prices

Newton (Ohio St.) DMAP 2013 May 2013 29 / 29