Frank Dellaert Fall 2019 Feature-based Image Alignment Geometric - - PowerPoint PPT Presentation

frank dellaert fall 2019 feature based image alignment
SMART_READER_LITE
LIVE PREVIEW

Frank Dellaert Fall 2019 Feature-based Image Alignment Geometric - - PowerPoint PPT Presentation

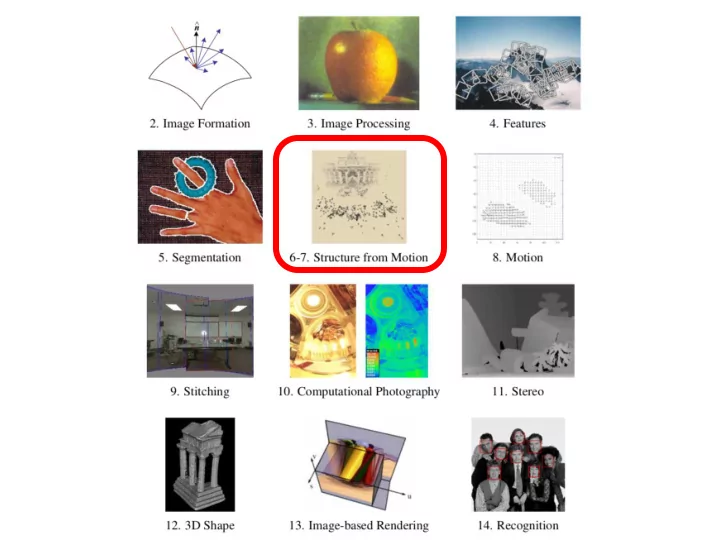
Frank Dellaert Fall 2019 Feature-based Image Alignment Geometric image registration 2D or 3D transforms between them Special cases: pose estimation, calibration Image credit Szeliski book Frank Dellaert Fall 2019 2D Alignment 3


slide-1
SLIDE 1

Frank Dellaert Fall 2019

slide-2
SLIDE 2

Frank Dellaert Fall 2019

Feature-based Image Alignment

  • Geometric image registration

– 2D or 3D transforms between them – Special cases: pose estimation, calibration

Image credit Szeliski book

slide-3
SLIDE 3

Frank Dellaert Fall 2019

2D Alignment

  • 3 photos
  • Translational model

Image credit Szeliski book

slide-4
SLIDE 4

Frank Dellaert Fall 2019

2D Alignment

  • Input:

– A set of matches {(xi, xi’)} – A parametric model f(x; p)

  • Output:

– Best model p*

  • How?

Image credit Szeliski book

slide-5
SLIDE 5

Frank Dellaert Fall 2019

2D translation estimation

  • Input:

– Set of matches {(x1, x1’), (x2, x2’), (x3, x3’), (x4, x4’)} – Parametric model: f(x; t) = x + t – Parameters p == t, location of origin of A in B

  • Output:

– Best model p*

Image credit Szeliski book

slide-6
SLIDE 6

Frank Dellaert Fall 2019

2D translation estimation

  • Input:

– Set of matches {(x1, x1’), (x2, x2’), (x3, x3’), (x4, x4’)} – Parametric model: f(x; t) = x + t – Parameters p == t, location of origin of A in B

  • Question for class:

– What is your best guess for model p* ??

Image credit Szeliski book

slide-7
SLIDE 7

Frank Dellaert Fall 2019

2D translation estimation

  • How?

– One correspondence x1 = [600, 150], x1’ = [50, 50] – Parametric model: x’ = f(x; t) = x + t => t = x’- x => t = [50-600, 40-150] = [-550, -100]

[-550, -100] Image credit Szeliski book

slide-8
SLIDE 8

Frank Dellaert Fall 2019

2D translation via least-squares

  • How?

– A set of matches {(xi, xi’)} – Parametric model: f(x; t) = x + t – Minimize sum of squared residuals:

Image credit Szeliski book

slide-9
SLIDE 9

Frank Dellaert Fall 2019

How to solve?

Jacobian Hessian Normal equations

slide-10
SLIDE 10

Frank Dellaert Fall 2019

Linear models menagerie

  • All the simple 2D models are linear!
  • Exception: perspective transform

Figure credit Szeliski book

slide-11
SLIDE 11

Frank Dellaert Fall 2019

2D translation via least-squares

Image credit Szeliski book

slide-12
SLIDE 12

Frank Dellaert Fall 2019

Oops I lied !!! Euclidean is not linear!

  • All the simple 2D models are linear!
  • Euclidean Jacobians are a function of θ!

Figure credit Szeliski book

slide-13
SLIDE 13

Frank Dellaert Fall 2019

Nonlinear Least Squares

slide-14
SLIDE 14

Frank Dellaert Fall 2019

Projective/H

  • Jacobians a bit harder
  • Parameterization:
  • x’= f(x,p):
  • And Jacobian:

Image credit Graphics Mill (educational Use)

slide-15
SLIDE 15

Frank Dellaert Fall 2019

Closed Form H

  • Taking x’=f(x,p):
  • Divide both sides by :
  • 4 matches => system of 8 linear equations

Image credit Graphics Mill (educational Use)

slide-16
SLIDE 16

RANSAC

slide-17
SLIDE 17

Frank Dellaert Fall 2019

Motivation

  • Estimating motion models
  • Typically: points in two images
  • Candidates:

– Translation – Homography – Fundamental matrix

slide-18
SLIDE 18

Frank Dellaert Fall 2019

Mosaicking: Homography

www.cs.cmu.edu/~dellaert/mosaicking

slide-19
SLIDE 19

Frank Dellaert Fall 2019

Two-view geometry (next lecture)

slide-20
SLIDE 20

Frank Dellaert Fall 2019

Omnidirectional example

Images by Branislav Micusik, Tomas Pajdla, cmp.felk.cvut.cz/ demos/Fishepip/

slide-21
SLIDE 21

Frank Dellaert Fall 2019

Simpler Example

  • Fitting a straight line
slide-22
SLIDE 22

Frank Dellaert Fall 2019

Discard Outliers

  • No point with d>t
  • RANSAC:

– RANdom SAmple Consensus – Fischler & Bolles 1981 – Copes with a large proportion of outliers

Image credit Choi et al BMVC 2009

slide-23
SLIDE 23

Frank Dellaert Fall 2019

Main Idea

  • Select 2 points at random
  • Fit a line
  • “Support” = number of inliers
  • Line with most inliers wins

Image credit shutterstock, academic use

slide-24
SLIDE 24

Frank Dellaert Fall 2019

Why will this work ?

slide-25
SLIDE 25

Frank Dellaert Fall 2019

Best Line has most support

  • More support -> better fit

Image credit Wikipedia

slide-26
SLIDE 26

Frank Dellaert Fall 2019

In General

  • Fit a more general model
  • Sample = minimal subset

– Translation ? – Homography ? – Euclidean transorm ?

slide-27
SLIDE 27

Frank Dellaert Fall 2019

RANSAC

  • Objective:

– Robust fit of a model to data D

  • Algorithm

– Randomly select s points – Instantiate a model – Get consensus set Di – If |Di|>T, terminate and return model – Repeat for N trials, return model with max |Di|

Image credit Wikipedia

slide-28
SLIDE 28

Frank Dellaert Fall 2019

Distance Threshold

  • Requires noise distribution
  • Gaussian noise with s
  • Chi-squared distribution with DOF m

– 95% cumulative: – Line, F: m=1, t=3.84 s2 – Translation, homography: m=2, t=5.99\ s2

  • I.e. -> 95% prob that d<t is inlier

Image credit Wikipedia

slide-29
SLIDE 29

Frank Dellaert Fall 2019

How many samples ?

  • We want: at least one sample with all inliers
  • Can’t guarantee: probability P
  • E.g. P = 0.99

Image credit Wikipedia

slide-30
SLIDE 30

Frank Dellaert Fall 2019

Calculate N

  • If etha = outlier probability
  • proportion of inliers p = 1-etha
  • P(sample with all inliers) = ps
  • P(sample with an outlier) = 1-ps
  • P(N samples an outlier) = (1-ps)^N
  • We want P(N samples an outlier) < 1-P e.g. 0.01
  • (1-ps)^N < 1-P
  • N > log(1-P)/log(1-ps)

Image credit Wikipedia

slide-31
SLIDE 31

Frank Dellaert Fall 2019

Example

  • P=0.99
  • s=2, etha=5%

=> N=2

  • s=2, etha=50%

=> N=17

  • s=4, etha=5%

=> N=3

  • s=4, etha=50%

=> N=72

  • s=8, etha=5%

=> N=5

  • s=8, etha=50%

=> N=1177

Image credit Wikipedia

slide-32
SLIDE 32

Frank Dellaert Fall 2019

Remarks

  • N = f(etha), not the number of points
  • N increases steeply with s

Image credit Wikipedia

slide-33
SLIDE 33

Frank Dellaert Fall 2019

Threshold T

  • Terminate if |Di|>T
  • Rule of thumb: T » #inliers
  • So, T = (1-etha)n = pn

Image credit Wikipedia

slide-34
SLIDE 34

Frank Dellaert Fall 2019

Adaptive N

  • When etha is unknown ?
  • Start with etha = 50%, N=inf
  • Repeat:

– Sample s, fit model – -> update etha as |outliers|/n – -> set N=f(etha, s, p)

  • Terminate when N samples seen

Image credit Wikipedia