Function Transformations In this course we learn to identify a - - PowerPoint PPT Presentation

function transformations
SMART_READER_LITE
LIVE PREVIEW

Function Transformations In this course we learn to identify a - - PowerPoint PPT Presentation

Function Transformations In this course we learn to identify a variety of functions: linear functions, Elementary Functions quadratic and cubic functions, general polynomial Part 1, Functions Lecture 1.3a, Transformations of Functions: Shifts


slide-1
SLIDE 1

Elementary Functions

Part 1, Functions Lecture 1.3a, Transformations of Functions: Shifts

  • Dr. Ken W. Smith

Sam Houston State University

2013

Smith (SHSU) Elementary Functions 2013 1 / 35

Function Transformations

In this course we learn to identify a variety of functions: linear functions, quadratic and cubic functions, general polynomial and rational functions, exponential and logarithmic functions, trigonometric functions and inverse trig functions. Many of these functions can be identified by their “shape”. We will identify some basic functions and then learn transformations of the functions that give the same shape.

Smith (SHSU) Elementary Functions 2013 2 / 35

Function shape

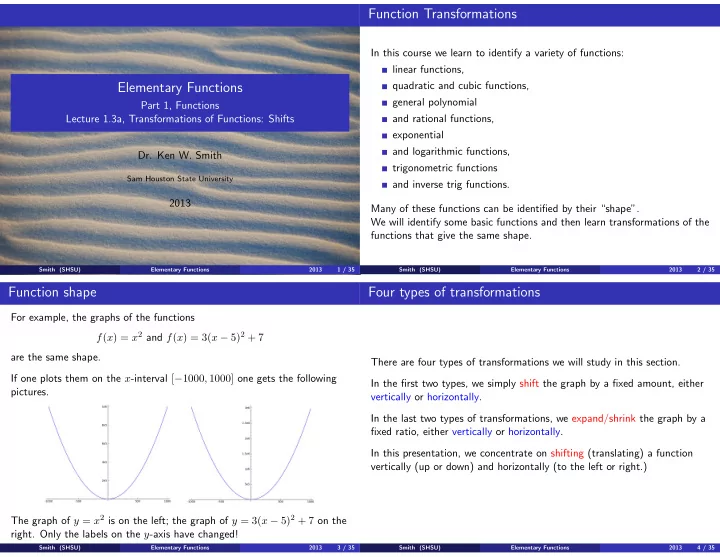
For example, the graphs of the functions f(x) = x2 and f(x) = 3(x − 5)2 + 7 are the same shape. If one plots them on the x-interval [−1000, 1000] one gets the following pictures. The graph of y = x2 is on the left; the graph of y = 3(x − 5)2 + 7 on the

  • right. Only the labels on the y-axis have changed!

Smith (SHSU) Elementary Functions 2013 3 / 35

Four types of transformations

There are four types of transformations we will study in this section. In the first two types, we simply shift the graph by a fixed amount, either vertically or horizontally. In the last two types of transformations, we expand/shrink the graph by a fixed ratio, either vertically or horizontally. In this presentation, we concentrate on shifting (translating) a function vertically (up or down) and horizontally (to the left or right.)

Smith (SHSU) Elementary Functions 2013 4 / 35

slide-2
SLIDE 2

Vertical shifts

It is easy to shift the graph y = f(x) up (vertically) by a fixed positive amount c. Just add c to the y-value, that is, create the graph of y = f(x) + c. If we can shift up by a fixed amount then shifting down is also easy – just make c negative. If c is negative then the graph of y = f(x) + c shifts the graph down by |c|. (For example, y = f(x) − 2 will shift the graph down by 2.) Consider the graph of y = x2. The graph of y = x2 + 1 shifts the graph of y = x2 up one unit. The graph of y = x2 + 3 shifts the graph of y = x2 up three units. The graph of y = x2 − 2 shifts the graph down by two units.

Smith (SHSU) Elementary Functions 2013 5 / 35

Vertical shifts

Let’s graph these all on one plane to show the effect of the shifting. Here are graphs of y = x2, y = x2 + 1,y = x2 + 3, y = x2 − 2,

Smith (SHSU) Elementary Functions 2013 6 / 35

Horizontal shifts

Horizontal shifts are very similar, but there is a subtlety here. Because the horizontal x-axis represents inputs to the function, if we want to shift the curve to the right (in the positive x-direction) by a positive amount c then we need to “prepare” the input by subtracting the amount c from x before it is inserted into the function. This may be the opposite of what one expects, but by subtracting c from x, we make an input x − c on the left of x act like the input x and this shift, moving x − c to x is a shift to the right. In the next slide we graph y = x2, y = (x − 1)2 and y = (x − 3)2.

Smith (SHSU) Elementary Functions 2013 7 / 35

Horizontal shifts

The graph of y = x2

Smith (SHSU) Elementary Functions 2013 8 / 35

slide-3
SLIDE 3

Horizontal shifts

The graph of y = x2 and y = (x − 1)2

Smith (SHSU) Elementary Functions 2013 9 / 35

Horizontal shifts

The graph of y = x2 and y = (x − 1)2 and y = (x − 3)2

Smith (SHSU) Elementary Functions 2013 10 / 35

Horizontal shifts

The graph of y = x2 and y = (x − 1)2 and y = (x − 3)2 y = (x − 1)2 shifts the parabola 1 to the right; y = (x − 3)2 shifts it 3 to the right.

Smith (SHSU) Elementary Functions 2013 11 / 35

Horizontal shifts

The graph of y = x2

Smith (SHSU) Elementary Functions 2013 12 / 35

slide-4
SLIDE 4

Horizontal shifts

The graph of y = x2 and y = (x + 2)2

Smith (SHSU) Elementary Functions 2013 13 / 35

Horizontal shifts

The graph of y = x2 and y = (x + 2)2 y = (x + 2)2 shifts the parabola 2 to the left.

Smith (SHSU) Elementary Functions 2013 14 / 35

Horizontal shifts

Here they are all together: y = x2, y = (x − 1)2 y = (x − 3)2 y = (x + 2)2

Smith (SHSU) Elementary Functions 2013 15 / 35

Expansions & shrinks

In this presentation we examined shifts of functions, vertically and horizontally. In the next presentation, we will examine expansions & contractions of functions (END)

Smith (SHSU) Elementary Functions 2013 16 / 35

slide-5
SLIDE 5

Elementary Functions

Part 1, Functions Lecture 1.3b, Transformations of Functions: Expansions/contractions

  • Dr. Ken W. Smith

Sam Houston State University

2013

Smith (SHSU) Elementary Functions 2013 17 / 35

Four types of function transformations

There are four basic types of transformations of functions. In the first two types, we simply shift the graph by a fixed amount, either vertically or horizontally. In the last two types of transformations, we expand/shrink the graph by a fixed ratio, either vertically or horizontally. In the previous presentation (1.3a) we looked at translations. A vertical shift by c occurred when we simply replaced y = f(x) by y = f(x) + c. A horizontal shift by c occurred when we replaced y = f(x) by y = f(x − c). (Note the subtraction of c!) In this presentation we look at expansions & contractions.

Smith (SHSU) Elementary Functions 2013 18 / 35

Vertical expansions & shrinks

What if we want to expand or shrink the image of our graph? We can do this in the vertical (y-direction) simply by multiplying our function by a

  • constant. For example, if we have the graph y = f(x) then the graph of

y = 3f(x) will stretch (expand) the graph by a factor of 3 in the y-direction. The graph of y = 1 3f(x) will contract (shrink) the graph by a factor of 3. Multiplying f(x) by −1 will flip the graph over, reflecting it across the x-axis, replacing positive y-values by negative ones and conversely, replacing negative y-values by positive ones. This is our first example of a reflection. The graph of y = −f(x) is a reflection of y = f(x) across the x-axis.

Smith (SHSU) Elementary Functions 2013 19 / 35

Horizontal expansions & shrinks

We can also expand or contract a graph in the horizontal direction, along the x-axis. But, just like horizontal shifts, because the horizontal axis represents the input variable, the action may be the reverse of what one might expect. To expand the graph horizontally by a factor of 2, we must divide x by 2 before inserting it into the function. On the next slide, in thick black ink, is the graph of y = x2. In lighter blue ink is the graph of y = (x 2)2. By dividing x by two, we stretch the graph in the horizontal direction by a factor of 2.

Smith (SHSU) Elementary Functions 2013 20 / 35

slide-6
SLIDE 6

Horizontal expansions & shrinks

The graph of y = x2 Graphs of y = x2 (thick black curve), y = (x 2)2 (thin blue),

Smith (SHSU) Elementary Functions 2013 21 / 35

Horizontal expansions & shrinks

The graph of y = x2 and y = (x 2)2 Graphs of y = x2 (thick black curve), y = (x 2)2 (thin blue), If instead we multiply the input variable x by a constant, we will contract (shrink) the graph in the horizontal direction. In the picture below, the graph of y = x2 is again a thick black curve; the graph of y = (2x)2 is the thinner green curve and if we graph y = (5x)2 we get the curve in red, shrunk even more in the horizontal direction. If we replace x by −x, we interchange the role of positive and negative x-values and so we reflect the graph across the y-axis. This is our second example of a reflection.

Smith (SHSU) Elementary Functions 2013 22 / 35

Horizontal expansions & shrinks

The graph of y = x2

Smith (SHSU) Elementary Functions 2013 23 / 35

Horizontal expansions & shrinks

The graph of y = x2 and y = (2x)2

Smith (SHSU) Elementary Functions 2013 24 / 35

slide-7
SLIDE 7

Horizontal expansions & shrinks

The graph of y = x2 and y = (2x)2 and y = (5x)2

Smith (SHSU) Elementary Functions 2013 25 / 35

Horizontal expansions & shrinks

The graph of y = x2 and y = (2x)2 and y = (5x)2 By multiplying x by 2 or by 5, we shrunk (contracted) the x-axis.

Smith (SHSU) Elementary Functions 2013 26 / 35

Putting it all together

In summary,

1 To shift a function up by c units, replace y = f(x) by y = f(x) + c. 2 To shift a function to the right by c units, replace y = f(x) by

y = f(x − c).

3 To expand a function vertically by a factor of c, replace y = f(x) by

y = cf(x).

4 To expand a function horizontally by a factor of c, replace y = f(x)

by y = f(x c ). We can combine these transformations by creating a sequence of transformations. For example, we could translate a function in a diagonal direction,

  • ver to the right by 2 and then up by 2 by replacing f(x) by f(x − 2) + 2.

Replacing x by x − 2 moves the graph 2 units to the right; then adding 2 to the entire function moves the graph up two units.

Smith (SHSU) Elementary Functions 2013 27 / 35

Some more examples

What transformation is required to map the graph on the left (in red) to the graph on the right (in blue)?

  • Solution. Shift the red graph up by 3.

So, if the red graph is y = f(x) then the blue graph is y = f(x) + 3.

Smith (SHSU) Elementary Functions 2013 28 / 35

slide-8
SLIDE 8

Some more examples

What transformation is required to map the graph on the left (in red) to the graph on the right (in blue)?

  • Solution. Shift the red graph to the right by 2 and up by 4.

So, if the red graph is y = f(x) then we replace x by x − 2 (inside the function) and add 4 on the outside so that the blue graph is y = f(x − 2) + 4.

Smith (SHSU) Elementary Functions 2013 29 / 35

Some more examples

What transformation is required to map the graph on the left (in red) to the graph on the right (in blue)?

  • Solution. We reflected the graph across the x-axis.

So, if the red graph is y = f(x) then the blue graph is y = −f(x).

Smith (SHSU) Elementary Functions 2013 30 / 35

Some more examples

What transformation is required to map the graph on the left (in red) to the graph on the right (in blue)?

  • Solution. Expand the red graph by a factor of 2 in the horizontal

direction. So, if the red graph is y = f(x) then the blue graph is y = f( x

2) since

doubling horizontally requires dividing x by 2.

Smith (SHSU) Elementary Functions 2013 31 / 35

Moving graphs around

Examples.

1 Consider the graphs below. The one on the left is the graph of

f(x) = |x|. On the right, the original graph has been contracted horizontally by a factor of two and then shifted 2 units to the right and then up 1 unit. What function is graphed on the right?

  • Solution. First contract the graph horizontally by a factor of 2,

replacing x by 2x. Then shift the graph to the right by 2, replacing x

Smith (SHSU) Elementary Functions 2013 32 / 35

slide-9
SLIDE 9

Moving graphs around

Examples.

1 Consider the graphs below. The one on the left is the graph of

f(x) = |x|. What function is graphed on the right?

  • Solution. The graph on the right is y = |2(x − 2)| + 1.

Smith (SHSU) Elementary Functions 2013 33 / 35

More moving graphs...

2 What transformations (in order) must be done to the graph of

y = f(x) to create the graph of y = 2f(x − 5 3 ) − 7 ?

  • Solutions. Think about the process of inputting an x-value. Do the

following steps, in this order:

1 Shift right by 5 2 Expand horizontally by a factor of 3 (about the line x = 5) 3 Expand vertically by a factor of 2 4 Shift down 7.

Smith (SHSU) Elementary Functions 2013 34 / 35

A single form for all our transformations

These four types of transformations can be combined into a single form, changing f(x) into the expression af(b(x − c)) + d where (first) subtracting c translates everything to the right by c units, (second) multiplying by b inside the function shrinks the graph (centered

  • n fixes (c, 0)) in the horizontal direction by a factor of b

while (third) multiplying by a on the outside of the function expands the graph vertically by a factor of a. Finally (fourth) adding d to the entire piece raises the graph d units up. We will apply these transformations throughout our precalculus course. (END)

Smith (SHSU) Elementary Functions 2013 35 / 35