SLIDE 1 Page 1 of 16
GRADUATE DIPLOMA IN MANAGEMENT Cold Stores PLC GDM 403 – MANAGING FINANCE MODEL EXAMINATION PAPER Model Answer
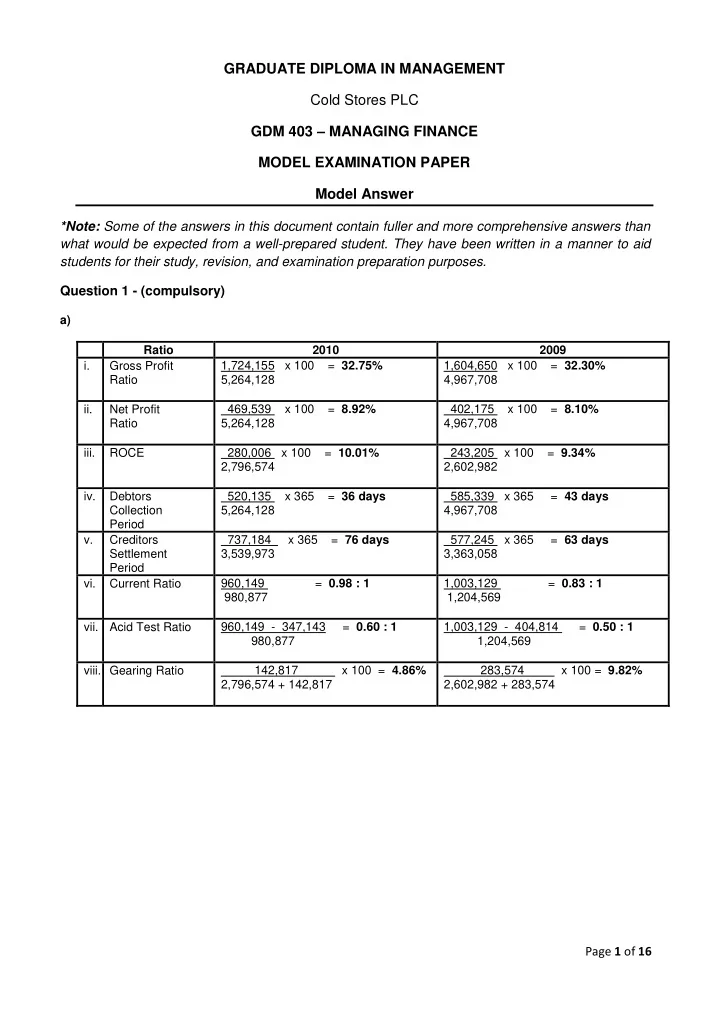
*Note: Some of the answers in this document contain fuller and more comprehensive answers than what would be expected from a well-prepared student. They have been written in a manner to aid students for their study, revision, and examination preparation purposes. Question 1 - (compulsory)
a) Ratio 2010 2009 i. Gross Profit Ratio 1,724,155 x 100 = 32.75% 5,264,128 1,604,650 x 100 = 32.30% 4,967,708 ii. Net Profit Ratio 469,539 x 100 = 8.92% 5,264,128 402,175 x 100 = 8.10% 4,967,708 iii. ROCE 280,006 x 100 = 10.01% 2,796,574 243,205 x 100 = 9.34% 2,602,982 iv. Debtors Collection Period 520,135 x 365 = 36 days 5,264,128 585,339 x 365 = 43 days 4,967,708 v. Creditors Settlement Period 737,184 x 365 = 76 days 3,539,973 577,245 x 365 = 63 days 3,363,058 vi. Current Ratio 960,149 = 0.98 : 1 980,877 1,003,129 = 0.83 : 1 1,204,569
960,149 - 347,143 = 0.60 : 1 980,877 1,003,129 - 404,814 = 0.50 : 1 1,204,569
142,817 x 100 = 4.86% 2,796,574 + 142,817 283,574 x 100 = 9.82% 2,602,982 + 283,574
SLIDE 2 Page 2 of 16
b) Report To : Managing Director, Cold Stores PLC From : Name Date : 1 January 2011 Subject : Commenting on the financial performance and position of Cold Stores PLC Introduction I have been asked to examine the most recent financial statements of Cold Stores PLC. This report is based upon my analysis of the financial statements of the company for the year ended 31 December 2010 together with the comparative figures for the previous year. The analysis is based upon a number of relevant accounting ratios which have been calculated previously. Financial Performance Cold Stores (CS) has been able to maintain a stable financial performance across the two years 2010 and 2009, with the GP, NP, and ROCE ratios showing consistent figures. GP ratio has shown a slight increment from 32.30% to 32.75%. The reason behind this should be the fact that the sales revenue increment of about 6% has been consumed by the cost of sales increment of about 6%. Thus, CS should focus on methods to reduce their cost of sales through ways such as planning production to facilitate bulk buying to obtain discounts, more internal sourcing of natural resources by improving the number of farmers dedicated to supply raw materials to CS, and other internal sourcing initiatives. The NP ratio has shown a decrement, though negligible, when coming to 2010. The NP ratio is currently at 8.92% from 2009’s 8.10%. It is visible that whilst expenses such as distribution and administration have not shown significant variations, other operating expenses have increased by about Rs. 1 million. However, this increment has been set-off by the reduction of the interest expense and increase in the
- ther operating income. It is advisable that the management looks into this increment of other operating
expenses and take necessary remedial actions to rectify the same. ROCE has been about 10% in both the years, which is a healthy figure, which would retain existing shareholders as well as attract future shareholders. Financial Position A key highlight with consideration to CS’s financial position is that it is recovering from an overdraft situation, and moving into a cash rich position when coming into 2010. The debtors’ collection period has reduced by one week. This is probably due to the company’s 2010’s sales being mostly in cash and the previous debtors having paid in to the company in 2010, the company’s trade and other receivable has decreased by about Rs. 65 million. This can also be seen as reason for the company’s cash position turnaround. The organisation should ensure that this positive trend continues into the future. The creditors’ settlement period has increased by about two weeks, and currently stands at 76
- days. This is an acceptable level in general, and is a positive factor when considering the company’s
working capital position. However, considering part of the company’s trade creditors being farmers in rural areas such as Pilimatalawa, Daulagala, Danthurai, Hedeniya and Kandy regions of Hatharaliyadda, Pujapitiya and Aludeniya, it may seem unethical to latent the payments to them, as their livelihoods depend on CS’s timely payments. Thus, it can be advised that whilst maintaining the current creditor’s payment period, to prioritise the suppliers and ensure that better timely payments are made to suppliers such as farmers. Both the current ratio and the acid test ratio have shown favourable increments when coming to 2010 (current ratio from 0.83 : 1 to 0.98 : 1, and acid test ratio from 0.50 : 1 to 0.60 : 1), highlighting the healthy
SLIDE 3 Page 3 of 16
cash position achieved in 2010. This turnaround is highly commendable and the management should focus on maintaining the same trend in to the future. CS is a considerably low geared organisation, where they further lowered their gearing level to 4.86% in 2010, from its 9.82% in 2009. This is due to CS having paid about Rs. 140 million of their interest bearing borrowings during 2010. Having paid a significant amount of the loans and still showing a turnaround in their cash position is a highly commendable achievement by CS. The reduction of these borrowings have resulted in lowered interest payments in 2010, as mentioned prior, and has contributed towards the
- rganisation’s financial performance.
Conclusion CS has shown a consistent financial performance and a healthy financial position when coming to 2010. Key highlights are that CS has paid off a significant amount from their borrowings, whilst maintaining a similar financial performance to that of 2009 and achieving a turnaround in their cash position. The management and staff of CS should be commended for the same whilst they should focus on taking necessary actions on the areas highlighted in this report, to ensure more improved financial status in 2011. Signed, Name
SLIDE 4 Page 4 of 16
c) *all calculation in thousands (‘000) New Profit before Tax calculation to support Net Profit Margin ratio - Detail Working Answer Sales revenue 5,264,128 x 1.10 5,790,541 Cost of sales Does not change (3,539,973) Other operating income Does not change 79,167 Distribution expenses 823,243 x 1.15 (946,729) Administrative expenses 262,699 x 1.15 (302,104) Other operating expenses Does not change (170,939) Finance expenses Does not change (67,902) Profit Before Tax
New borrowings calculation to support Gearing ratio - Detail Working Answer Previous borrowings (2010)
New loan amount
Total borrowings 142,817 + 50,000 192,817 New ratios - Detail Working Answer Net Profit ratio 842,061 x 100 5,790,973 14.55% Gearing ratio 192,817 x 100 2,796,574 + 192,817 6.45% Recommendation – As per the above calculations, it is clear that Cold Stores PLC is in adherence to both the policies after
- btaining the loan, where net profit ratio is 14.55% (above 10%), and gearing ratio is 6.45% (below 15%).
Therefore, it can be recommended that Cold Stores PLC obtains the proposed long term loan.
SLIDE 5
Page 5 of 16
d) Importance and use of financial information to the key stakeholders of Cold Stores PLC: We can identify the following parties as key stakeholders of Cold Stores PLC: Farmers and other suppliers Customers Competitors Government Media It is important to provide financial information to the mentioned stakeholders as they aid in their various decision making activities, and enables them to obtain a clear understanding about the financial related aspects and prospects of the organisation. The use of financial information can be set out specifically as below: Farmers and other suppliers – to understand the company’s ability to make payments on a timely basis Customers – to seek opportunities to obtain discounts on future purchases and extended credit periods Competitors – to benchmark aspects such as profitability, revenue, expenses and assets Government – to understand that timely payment of taxation Recommendations on CSR activities which Cold Stores can undertake, and how such activities can affect their profitability: As Cold Stores concerns Corporate Social Responsibility (CSR) as priority and gives high concern towards the welfare of its employees, suppliers and the society as a whole, it is important that they give the due focus towards exercising various CSR activities. Few CSR activities that they could undertake can be stated as below: Cold Stores can conduct various health campaigns in villages such as in Pilimatalawa, Daulagala, Danthurai, Hedeniya and Kandy regions of Hatharaliyadda, Pujapitiya and Aludeniya, as these areas consist of farmers who supply ginger to Cold Stores Cold Stores can aim at the reduction of waste disposal during their manufacturing of various products such as beverages and ice cream. Save the environment campaigns Cold Stores can seek to increase direct purchase of other raw materials required in their production from farmers, not being just limited to direct purchasing of ginger from ginger farmers. CSR activities can have an impact on Cold Stores’ profitability, which can be two fold. In the short term, it will lead to a decrement in profitability due to cost on CSR activities. However, in the long term, Cold Stores can anticipate a possible increase in profitability due to positive customers perception and attraction resultant from the CSR initiatives.
SLIDE 6 Page 6 of 16 Question 2
a) Budgets can be defined as a quantitative plan of action relating to a given period of time. It is an important activity than any business organisation would conduct and the purposes of budget preparation can be explained as bellows: Authorisation & delegation Budgets can be used as a formal technique to delegate different functions to functional heads. Further, budgets would provide the necessary authority to the relevant parties to take action towards the achievement of the set-budgets. Performance evaluation Budgets can be used within organisations to aid their performance evaluation initiatives. This is where; budgets can be compared with the actual results at the end of the time period (year) to see whether the performance is favourable or adverse compared to the budget. Tool of motivation Budgets can be used as a tool of motivation, where they can be used in such a way to motivate
- employees. However, to use budgets as a tool of motivation, budgets need to be linked to
incentives (financial or non-financial), where the achievement of the budgets will provide employees with incentives, and thus motivation. Therefore, budgets become an important aspect for any business organisation. b) i. Sales Budget Details Product X Product Y Sales (units) 4000 5000 ii. Production Budget Details Product X Product Y Sales (units) 4000 5000 (-) Opening Stock (1000) (1000) + Closing Stock 900 1100 Production (units) 3900 5100 iii. Material Usage Budget Details Material A Material B Product X 15,600 11,700 Y 25,500 30,600 Material Usage (kg) 41,100 42,300 iv. Material Purchase Budget Details Material A Material B Material Usage (kg) 41,100 42,300 (-) Opening Stock (4600) (3800) + Closing Stock 4900 4200
SLIDE 7
Page 7 of 16
Material Purchases (kg) 41,400 42,700 Material Purchase (value) 496,800 341,600 v. Direct Labour Budget Details Skilled Labour Unskilled Labour Product X 11,700 7800 Y 15,600 25,500 Labour Requirement (hours) 27,300 33,300 Labour Requirement (value) 273,000 166,500
SLIDE 8 Page 8 of 16 Question 3
a)
- It is assumed that all costs are classified as either fixed or variable. Accordingly, the information
- n fixed cost and variable cost is used in the breakeven analysis related calculations.
- Even though in the modern dynamic business environment, unit selling price and unit variable cost
can become variable due to various factors, for breakeven analysis purposes, it is assumed that they will remain constant and they are known with certainty. b) (i) BE point (in units) = (180 + 50 + 120) = 35,000 units 10 BE point (in value) = 35,000 x 20 = £ 700,000 (ii) MOS (in units) = 70,000 – 35,000 = 35,000 units MOS (in value) = 35,000 x 20 = £ 700,000 (iii) Net Profit / (Loss) = (10 x 60,000) - 350,000 = £ 250,000 (iv) New contribution = 10 – 1 = £ 9 Number of units to be sold to achieve a net profit of £ 200,000 = (350 + 200) = 61,112 units 9
SLIDE 9 Page 9 of 16 Question 4
a) - Character of the borrower
- Amount of the loan
- Ability to borrow and repay
- Purpose of the loan
b) Sources of finance can be generally referred to as the methods or forms that companies obtain money in order to run their business operations. Share capital, borrowings, venture capital, government grants can be identified as four main sources of finance. Two sources of finance are explained below. Share Capital Share capital is funds raised by issuing shares in return for cash or other considerations. Share capital is composed of both ordinary and preference shares. Ordinary Shares denotes equity ownership in a company and entitles the owner to a vote in proportion to their percentage ownership in the company. These shares do not have any predetermined dividend
- amounts. Ordinary shares are generally traded privately. Preference Shares are shared which would
receive preference to be paid company assets first in an instance of bankruptcy or any other situation
- f company liquidation. Preference shares typically pay a fixed dividend, and dividends are paid before
- rdinary shares dividends are paid out. These shares generally do not have voting rights, and are
traded in the stock market. Borrowings Borrowings refer to obtaining finance from any third party of the company. Borrowings can be mainly classified into two as borrowings from banks and other ways of borrowings. Borrowings from banks can be in the forms of loans and overdrafts. Other ways of borrowing are in the forms of factoring, invoice discounting, leasing, and hire purchase. In conclusion, sources of finance are vital for a company’s performance and survival, whilst, the most suitable of finance becomes dependent upon various factors such as type of the company, size of the company, the specific requirement of the company, and the use of the finance. c) (i) Public Limited Companies falls under ‘Corporations’ under the categorisation of organisations. A Public Limited Company (PLC) should consist of at least 7 shareholders. There should be a minimum two directors with retirement age at 70. A main characteristic of a PLC is that it can invite public to subscribe capital via prospectus, and the shares can be freely traded through the Stock Exchange. Hayleys, Softlogic, John Keells, Aitken Spence, and LOLC can be identified as examples for PLCs. (ii) Working capital consists of two components, which are current assets and current liabilities. Working capital management relates to the efficient management of both these components in respect to each
The importance of working capital management is that it ensures that the company has sufficient cash flow to meet its short term debt obligations and also to manage their operational expenses. Over management would result in having cash tightened in current assets resulting in losing out on investment opportunities. Under management would result in the inability to service short term debt
- bligations leading to various risks such as reputational risks and penalty risks, and also inability to
maintain a smooth flow of organisational operations.
SLIDE 10
Page 10 of 16
The two working capital management strategies, namely, risk averse strategy and risk lovers strategy, can be recognised as examples for working capital management.
SLIDE 11
Page 11 of 16 Question 5
a) NPV ARR Used as a tool to aid investment decisions. Used as a tool to aid investment decisions. Uses cash flows for calculations. Uses accounting profit for calculations. Non cash flow items are omitted. Non cash flow items are included. Discounted cash flows are used. Time value of money is ignored. Ease of interpretation. Difficult to interpret. More suitable for investors. Comparatively less suitable for investors. a) (i) ARR ARR = Average Profit / Average Investment = { [ (50 + 60 + 70 + 40) / 4 ] / [ (665 + 165) / 2 ] } x 100 = 13.25% I recommend Crest Ltd to invest in the machine because the ARR is 13.25%. (ii) Payback Period 110 x 12 = 4 330 Payback period = 3 years and 4 months I do not recommend Crest Ltd to invest in the machine because the payback period is 3 years and 4 months. (iii) NPV Year Cash Flows £’000 PV £’000 Year 0 (665) (665) Year 1 175 159.08 Year 2 185 152.81 Year 3 195 146.45 Year 4 330 225.39 NPV 18.73 NPV = £ 18,730 I recommend Crest Ltd to invest in the machine, because the NPV is a positive £ 18,730. Year Annual Net Cash Flows £’000 Cumulative Net Cash Flows £’000 Year 0 (665) (665) Year 1 175 (490) Year 2 185 (305) Year 3 195 (110) Year 4 330
SLIDE 12
Page 12 of 16
(iv) IRR NPV at 20% discounting rate Year Cash Flows £’000 PV £’000 Year 0 (665) (665) Year 1 175 145.78 Year 2 185 128.39 Year 3 195 112.91 Year 4 330 159.06 NPV (118.86) IRR = 0.10 + [18.73 / (18.73 + 118.86)] x (0.20 – 0.10) = 11.36% I recommend Crest Ltd to invest in the machine, because the IRR (11.36%) is higher than the company’s cost of capital.
SLIDE 13 Page 13 of 16 Question 6
a) Pricing is where a company considers the amount for which their product or service should be introduced to the market, which provides them coverage for their cost as well as a profit margin. There are several practical pricing strategies used by business organisation, namely, Full Cost Plus Approach Marginal Cost Plus Approach Market Penetration Strategy Market Skimming Strategy Price Discrimination Strategy Premium Pricing Strategy Loss Leader Strategy Two practical pricing strategies are explained below: Market penetration strategy This is where the product/service is offered to the market at a relatively lower price, with the emphasis of capturing a large market share. This is a volume driven strategy, which could be practiced when the target market is price sensitive. An advantage of the market penetration strategy is that it enables the company to capture a large market share within a short period of time. However, the possibility of company not being able to cover their costs
- r to reach profit expectation due to being unable to sell the needed volume can be recognised as a
disadvantage of this pricing strategy. Ryan air’s ticket pricing, Hyundai’s automobile pricing, and Dialog’s mobile usage charges can be identified as examples for market penetration pricing. Market skimming strategy This is where the product/service would be launched to the market with a high introductory selling price which generates super profits during the initial stage of the product. This strategy is generally practiced on a unique product with a short life cycle, where the company is focussed on innovation. An advantage of the market skimming strategy is that it enables the company to recover costs such as R&D, which were spent on developing such unique products, before the competitors enter the market with similar products. However, the inability to practice this strategy on products which are price sensitive can be recognised as a disadvantage of this pricing strategy. Pricing on Apple products and Sony products can be identified as examples for market skimming pricing. b) (i) 10 = a + 0b -------- (01) 0 = a + 5000b -------- (02) a = 10 b = – 0.002 p = 10 – 0.002x MR = a – 2bx MR = 10 – (2 x 0.002)x MR = 10 – 0.004x At profit maximisation,
SLIDE 14
Page 14 of 16
MR = MC 10 – 0.004x = 5 x = 1250 p = 10 – 0.002x p = 10 – (0.002 x 1250) p = 7.5 Times Ltd should sell 1250 units at a selling price of £ 7.50 in order to maximise profits. (ii) At revenue maximisation, MR = 0 10 – 0.004x = 0 x = 2500 p = 10 – 0.002x p = 10 – (0.002 x 2500) p = 5 Times Ltd should sell 2500 units at a selling price of £ 5 in order to maximise revenue.
SLIDE 15 Page 15 of 16 Question 7
a) A budget is quantitative plan of action relating to a specific time period. Organisations use an array of method in their budget preparation as follows; Top down method Participative method Rolling budgets Zero-based budgets Incremental method Two of the above mentioned budgeting methods are explained below with each of their advantages and disadvantages. Top down Method Under this method, the top management will prepare the budgets and force it down upon the lower management and employees. The top management may link incentives to the achievement of the set budgets, in order to make the budget achievement more attractive for the employees. Advantages:
- 1. Faster process
- 2. Better control for the management
Disadvantages:
- 1. The employees may not prefer this method because they will feel that they were not part of the
preparation of the budgets
Participative Method Under this method, budget holders are given the opportunity to participate in setting their own budgets. The organisation will form a ‘budget committee’ which will consist of members from all departments within the organisation, whom will participate in setting their own budgets. Advantages:
- 1. Improved quality of forecasts
- 2. Better motivation among employees
Disadvantages:
- 1. Time consuming and difficult task
- 2. Dysfunctional behaviour
As shown above, each budget preparation method carries its own advantages and disadvantages where it is up to the organisations to decide the most suitable budget preparation method, whilst taking the necessary action to remedy the negativities of the selected budget preparation method. b) VC per unit = (72,500 – 64,000) / (9500 – 7800) = £ 5 per unit (using the high-low method) Total VC @ 9500 units level = 5 x 9500 = £ 47,500 Total FC @ 9500 units level = 72,500 – 47.500 = £ 25,000
SLIDE 16 Page 16 of 16
Flexible Budgets: *Values are in Pounds (£) Details Master Budget (9500 units) Flexed Budget (9000 units) Flexed Budget (7500 units) Sales Revenue 95,000 90,000 75,000 Less: Cost of Sales Variable Cost Fixed Cost (47,500) (25,000) (40,000) (25,000) (37,500) (25,000) Expected Profit / (Loss) 22,500 25,000 12,500