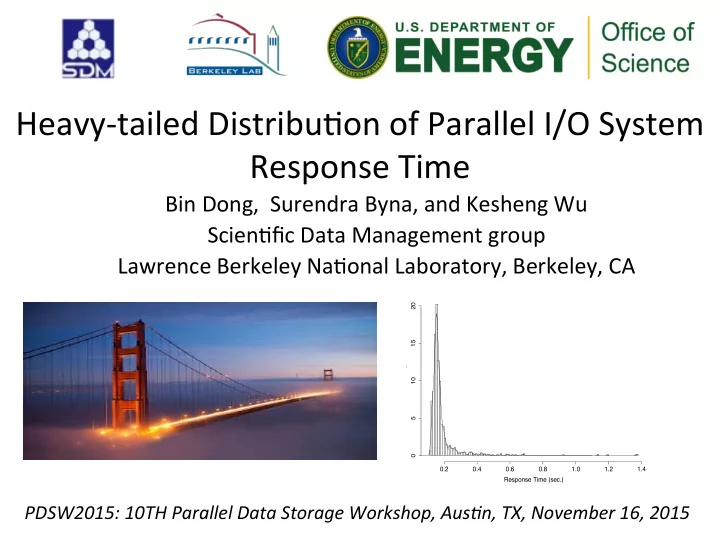
Heavy-tailed Distribu1on of Parallel I/O System Response - - PowerPoint PPT Presentation

heavy tailed distribu1on of parallel i o system response
SMART_READER_LITE
LIVE PREVIEW

Heavy-tailed Distribu1on of Parallel I/O System Response - - PowerPoint PPT Presentation

Heavy-tailed Distribu1on of Parallel I/O System Response Time Bin Dong, Surendra Byna, and Kesheng Wu Scien1fic Data Management group Lawrence


slide-1
SLIDE 1

Heavy-­‑tailed ¡Distribu1on ¡of ¡Parallel ¡I/O ¡System ¡ Response ¡Time ¡ ¡

Bin ¡Dong, ¡ ¡Surendra ¡Byna, ¡and ¡Kesheng ¡Wu ¡ ¡ Scien1fic ¡Data ¡Management ¡group ¡ Lawrence ¡Berkeley ¡Na1onal ¡Laboratory, ¡Berkeley, ¡CA ¡

PDSW2015: ¡10TH ¡Parallel ¡Data ¡Storage ¡Workshop, ¡Aus;n, ¡TX, ¡November ¡16, ¡2015 ¡

Read (Stripe Size: 64MB) Response Time (sec.) Probability 0.2 0.4 0.6 0.8 1.0 1.2 1.4 5 10 15 20

slide-2
SLIDE 2

Outline ¡

  • Mo1va1on ¡
  • Response ¡1me ¡sampling ¡method ¡
  • Analysis ¡results ¡of ¡response ¡1me ¡

¡ ¡

slide-3
SLIDE 3

Es1ma1ng ¡Response ¡Time ¡of ¡I/O ¡is ¡Essen1al ¡Element ¡

  • Data ¡analysis ¡query ¡plan ¡op1mizing ¡ ¡

– Choose ¡index ¡or ¡data ¡organiza1on ¡with ¡minimum ¡ read ¡1me ¡ – Scien1fic ¡Data ¡Services ¡(SDS) ¡framework, ¡ ¡ PostgresSQL, ¡SciDB ¡

  • Data ¡wri1ng ¡performance ¡tuning ¡

– Select ¡striping ¡size, ¡striping ¡account, ¡and ¡other ¡ parameters ¡to ¡reduce ¡write ¡1me ¡ – ExaHDF5, ¡I/O ¡Scheduler ¡

  • Simulator, ¡ ¡Job ¡Scheduler ¡, ¡Quality ¡of ¡service ¡(QoS), ¡etc. ¡ ¡
slide-4
SLIDE 4

Modeling ¡Response ¡Time ¡for ¡Parallel ¡I/O ¡

Response ¡1me ¡of ¡a ¡single ¡big ¡file ¡request ¡R: ¡ ¡ ¡ ¡ ¡ ¡T ¡= ¡max ¡(t1 ¡, ¡t2 ¡, ¡ ¡. ¡. ¡. ¡, ¡ ¡tn ¡) ¡+ ¡μ ¡ ¡

I/O ¡Servers ¡in ¡PFS ¡ (e.g., ¡OST ¡in ¡Lustre) ¡ t1 ¡, ¡t2 ¡, ¡. ¡. ¡., ¡tn: ¡response ¡1mes ¡

  • f ¡n ¡small ¡requests ¡

. ¡. ¡. ¡

r1 ¡

r2 ¡ rn ¡

t1 ¡ t2 ¡ tn ¡ T ¡ μ ¡= ¡ ¡

¡ ¡ ¡ ¡ ¡ ¡Split ¡overhead, ¡ ¡ ¡ ¡ ¡write ¡ Merge ¡overhead, ¡ ¡ ¡ ¡ ¡ ¡read ¡

. ¡. ¡. ¡ R ¡

slide-5
SLIDE 5

Simplifying ¡Response ¡Time ¡Model ¡

  • Split/merge ¡overhead ¡ ¡μ ¡is ¡constant ¡ ¡
  • n ¡small ¡requests ¡ ¡ ¡≈ ¡ ¡ ¡n ¡sampling ¡(i.i.d.) ¡of ¡n ¡IO ¡Servers ¡
  • t1, ¡…, ¡tn ¡ ¡≈ ¡ ¡ ¡n ¡ ¡i.i.d. ¡sta1s1cal ¡variables ¡
  • Focus ¡study ¡on ¡one ¡(denoted ¡by ¡t) ¡among ¡t1, ¡…, ¡tn ¡ ¡ ¡

– t ¡: ¡ ¡con1nuously ¡distributed ¡variable ¡on ¡(0, ¡ ¡+∞) ¡

t1 ¡ T ¡ tn ¡ . ¡. ¡. ¡ T ¡= ¡max ¡(t1 ¡, ¡t2 ¡, ¡ ¡. ¡. ¡. ¡, ¡ ¡tn ¡) ¡+ ¡μ ¡ ¡ . ¡. ¡. ¡

slide-6
SLIDE 6

Applying ¡Order ¡Sta1s1cs ¡to ¡Es1mate ¡T ¡

  • Step ¡1 ¡: ¡ ¡ ¡Compute ¡density ¡func1on ¡fYi(y) ¡with ¡

Ft(x) ¡and ¡ft(x) ¡ ¡

– ¡Yi ¡: ¡ ¡the ¡i-­‑th ¡largest ¡value ¡ ¡(t1, ¡t2, ¡ ¡…, ¡ ¡tn) ¡ – ¡fYi(y) ¡ ¡= ¡F(y)n-­‑i(1-­‑F(y))n-­‑i ¡ft(y) ¡n!/[(i-­‑1)!(n-­‑i)!] ¡ ¡

  • Step ¡2 ¡: ¡ ¡ ¡Compute ¡response ¡1me ¡T ¡= ¡Yn ¡

¡

T ¡ ¡= ¡ ¡maximum ¡(t1, ¡. ¡. ¡. ¡, ¡ ¡tn ¡) ¡+ ¡μ ¡ ¡

Order ¡ ¡ Sta1s1cs ¡ ¡

¡ ¡ ¡ ¡ ¡ ¡ ¡ ¡ ¡ ¡ ¡ ¡ ¡ ¡ ¡ ¡ ¡ ¡t ¡ ¡: ¡ ¡ ¡con1nuously ¡distributed ¡variable ¡on ¡(0, ¡ ¡+∞) ¡ ¡ ¡ ¡ ¡ ¡ ¡ ¡ ¡ ¡ ¡ ¡ ¡ ¡Ft(x) ¡: ¡ ¡ ¡distribu1on ¡func1on ¡of ¡t ¡ ¡ ¡ ft(x) ¡= ¡Ft ¡’(x) ¡: ¡ ¡ ¡density ¡func1on ¡of ¡t ¡ ¡ ¡

slide-7
SLIDE 7

Problem ¡Statement ¡

  • What ¡is ¡the ¡distribu1on ¡func1on ¡F(t) ¡for ¡the ¡

response ¡1me ¡of ¡each ¡small ¡file ¡request? ¡

– Exis1ng ¡researches ¡assume ¡

  • Uniform ¡Distribu1on ¡
  • Normal ¡Distribu1on ¡

– Are ¡these ¡assump1ons ¡true ¡? ¡ – If ¡not, ¡are ¡there ¡other ¡distribu1ons ¡fi^ng ¡be_er ¡? ¡ ¡ ¡ ¡ ¡

slide-8
SLIDE 8

Our ¡Method ¡

  • Sample ¡the ¡response ¡1me ¡of ¡two ¡produc1on ¡

storage ¡systems ¡ ¡

  • Analyze ¡sta1s1cal ¡proper1es ¡of ¡response ¡1me ¡
slide-9
SLIDE 9

Response ¡Time ¡Sampling ¡Environments ¡

  • Hopper ¡and ¡Edison ¡at ¡NERSC1 ¡

– 153K ¡and ¡130K ¡ ¡CPU ¡cores, ¡1.28 ¡PF ¡and ¡2.39PF ¡ – 5000 ¡registered ¡users ¡ ¡ – 300 ¡online ¡ac1ve ¡users ¡on ¡Edison ¡ – I/O ¡Intensive ¡jobs ¡use ¡Lustre ¡ ¡

  • Lustre ¡file ¡system ¡

– Cache ¡on ¡client ¡and ¡I/O ¡server ¡ – Network ¡latency ¡ – 1 ¡~ ¡143 ¡OSTes ¡ ¡

Compu1ng ¡Node ¡ /w ¡Lustre ¡Client ¡ Cache ¡ Cache ¡ Lustre ¡OST ¡ Network ¡Router ¡

1Na;onal ¡Energy ¡Research ¡Scien;fic ¡Compu;ng ¡Center ¡

¡ ¡haps://www.nersc.gov/ ¡ ¡ ¡

slide-10
SLIDE 10

Sampling ¡Method ¡

  • One ¡job ¡sampling ¡one ¡OST ¡

– A ¡job ¡ ¡≈ ¡ ¡A ¡small ¡file ¡request ¡ – Measure ¡1me ¡of ¡reading ¡and ¡wri1ng ¡separately ¡ – Test ¡different ¡reading/wri1ng ¡sizes ¡

  • 12 ¡different ¡sizes: ¡512KB, ¡1MB, ¡2MB, ¡ ¡… ¡, ¡1024MB ¡

– Match ¡request ¡size ¡and ¡striping ¡size ¡

≈ ¡Job ¡

t ¡

slide-11
SLIDE 11

Sampling ¡Method ¡

  • Measure ¡response ¡1me ¡on ¡compu1ng ¡node ¡

– network, ¡disk, ¡cache ¡

  • Cache ¡Considera1on ¡

– No ¡Cache ¡

  • clear ¡cache ¡by ¡accessing ¡memory ¡ ¡

¡ ¡ ¡ ¡sized ¡data ¡before ¡sampling ¡ ¡

  • call ¡fsync() ¡ager ¡write ¡

– Cache ¡ ¡

  • High ¡frequently ¡sampling ¡ ¡

Compu1ng ¡Node ¡ /w ¡Lustre ¡Client ¡ Cache ¡ Cache ¡ Lustre ¡OST ¡ Network ¡Router ¡

slide-12
SLIDE 12

Sampling ¡Results ¡Sta1s1cs ¡Overview ¡

Start ¡Time ¡ End ¡Time ¡ Days ¡ # ¡of ¡ Sampling ¡ # ¡of ¡ ¡ OSTs ¡

Edison-­‑ ¡ No-­‑Cache ¡ 08/13/2014 ¡ 09/17/2014 ¡ 35 ¡

14,977 ¡ 12 ¡

Edison-­‑ Cache ¡ 02/20/2015 ¡ 02/20/2015 ¡ 1 ¡

927,691 ¡ 12 ¡

Hopper-­‑ ¡ No-­‑Cache ¡ 10/01/2014 ¡ 01/13/2015 ¡ 104 ¡

13,868 ¡ 12 ¡

Hopper-­‑ Cache ¡ 02/20/2015 ¡ 02/20/2015 ¡ 1 ¡

1,581,364 ¡ 12 ¡

Summary ¡ 141 ¡ 2,537,900 ¡ 48 ¡

slide-13
SLIDE 13

Variability ¡of ¡Raw ¡Response ¡Time ¡for ¡ ¡ Edison ¡and ¡Hopper, ¡Cache ¡and ¡No-­‑Cache ¡

slide-14
SLIDE 14

Ill-­‑fit ¡of ¡Uniform ¡or ¡Normal ¡Distribu1on ¡

Uniform ¡ ¡ Normal ¡ ¡ Uniform ¡ ¡ Normal ¡ ¡ Response ¡ ¡ 1me ¡of ¡different ¡ ¡ request ¡sizes ¡ ¡ Response ¡ ¡ 1me ¡of ¡different ¡ ¡ request ¡sizes ¡ ¡

Metrics ¡ ¡ Uniform ¡ Normal ¡ Kurtosis ¡

  • ­‑ ¡1.2 ¡

3 ¡ Skewness ¡ 0 ¡ 0 ¡

slide-15
SLIDE 15

Ill-­‑fit ¡of ¡Uniform, ¡Normal, ¡ ¡and ¡Other ¡Single ¡ Distribu1on ¡Func1on ¡

Read (Stripe Size: 64MB)

Response Time (sec.) Probability 0.2 0.4 0.6 0.8 1.0 1.2 1.4 5 10 15 20

Characters ¡of ¡Histogram: ¡

  • A ¡single ¡peak ¡
  • Nonsymmetrical ¡ ¡
  • Tail ¡is ¡real ¡long ¡ ¡

Single ¡distribu1on ¡func1ons ¡

  • Power ¡Law ¡ ¡ ¡
  • Weibull ¡
  • Exponen1al ¡ ¡
  • Log ¡Normal ¡ ¡
  • Gamma ¡
  • Normal ¡
  • Cauchy ¡
  • Uniform ¡

don’t ¡fit ¡very ¡well ¡! ¡

Histogram ¡

slide-16
SLIDE 16

Exploring ¡New ¡Distribu1ons ¡

  • Par11on ¡response ¡1me ¡into ¡Head ¡and ¡Tail ¡
  • Find ¡the ¡pivot ¡

– minimizing ¡KS ¡(Kolmogorov-­‑Smirnov) ¡distances ¡

Histogram ¡

Histogram ¡ Histogram ¡

  • Normal ¡
  • Cauchy ¡

¡

  • Power ¡Law ¡
  • Weibull ¡
  • Exponen1al ¡
  • Log ¡Normal ¡
  • Gamma ¡
slide-17
SLIDE 17

Fi^ng ¡Results ¡

  • Edison–NoCache, ¡ ¡Read ¡Response ¡Time, ¡ ¡64MB ¡

Accuracy ¡ ¡ Head ¡Group ¡ Normal ¡> ¡Cauchy ¡ Tail ¡Group ¡ Power ¡Law ¡> ¡Log ¡Normal ¡> ¡Exponen1al ¡> ¡Weibull ¡> ¡Gamma ¡ ¡

slide-18
SLIDE 18

Fi^ng ¡Results ¡

  • Edison–NoCache, ¡ ¡Write ¡Response ¡Time, ¡64MB ¡

Accuracy ¡ ¡ Head ¡Group ¡ Normal ¡> ¡Cauchy ¡ Tail ¡Group ¡ Power ¡Law ¡> ¡Weibull ¡> ¡Exponen1al ¡> ¡Log ¡Normal ¡> ¡Gamma ¡

slide-19
SLIDE 19

Percentage ¡of ¡Head ¡group ¡and ¡Tail ¡group ¡

  • 85% ¡in ¡Head ¡group ¡(i.e., ¡small ¡response ¡1me) ¡
  • 15% ¡in ¡Tail ¡group ¡(i.e., ¡long ¡response ¡1me) ¡
slide-20
SLIDE 20

What ¡is ¡Wrong ¡with ¡Using ¡Normal ¡or ¡Uniform? ¡

Long ¡Response ¡Time ¡(Rare ¡Event) ¡ Uniform ¡Distribu1on ¡

All ¡equal ¡ ¡

Normal ¡Distribu1on ¡ ¡

2.5% ¡ ¡

Real ¡Storage ¡Systems ¡ ¡ (Edison ¡and ¡Hopper) ¡

15% ¡

Read (Stripe Size: 64MB) Response Time (sec.) Probability 0.2 0.4 0.6 0.8 1.0 1.2 1.4 5 10 15 20

≈15% ¡

¡

≈2.5% ¡

¡

slide-21
SLIDE 21

Summary ¡

  • Distribu1on ¡func1on ¡of ¡response ¡1me ¡of ¡storage ¡system ¡is ¡

essen1al ¡in ¡es1ma1ng ¡I/O ¡performance ¡

  • We ¡collected ¡2,537,900 ¡response ¡1me ¡sampling ¡from ¡48 ¡

OSTes ¡of ¡2 ¡petascale ¡storage ¡systems ¡across ¡141 ¡days ¡ ¡

  • We ¡found ¡that ¡single ¡Normal ¡or ¡single ¡Power ¡law ¡does ¡not ¡

fit ¡the ¡response ¡1me ¡ ¡

  • We ¡found ¡that ¡“Normal ¡+ ¡Power ¡law” ¡fits ¡response ¡1me ¡

be_er ¡

  • Future ¡work ¡

– sample ¡other ¡storage ¡systems ¡ – build ¡accurate ¡performance ¡model ¡ ¡ – apply ¡model ¡to ¡applica1ons ¡

slide-22
SLIDE 22

Acknowledgments ¡

  • Office ¡of ¡Advanced ¡Scien1fic ¡Compu1ng ¡Research, ¡Office ¡of ¡

Science, ¡U.S. ¡Department ¡of ¡Energy ¡(Program ¡manager: ¡ Lucy ¡Nowell), ¡support ¡for ¡the ¡SDS ¡project ¡under ¡contract ¡ number ¡DE-­‑AC02-­‑05CH11231 ¡ ¡ ¡ ¡ ¡ ¡

  • Na1onal ¡Energy ¡Research ¡Scien1fic ¡Compu1ng ¡Center ¡

¡ ¡ ¡

slide-23
SLIDE 23

Heavy-­‑tailed ¡Distribu1on ¡of ¡Parallel ¡I/O ¡System ¡ ¡ Response ¡Time ¡ ¡

Bin ¡Dong, ¡ ¡Surendra ¡Byna, ¡and ¡Kesheng ¡Wu ¡ ¡ Scien1fic ¡Data ¡Management ¡group ¡ Lawrence ¡Berkeley ¡Na1onal ¡Laboratory, ¡Berkeley ¡

Thanks, ¡QuesGons ¡? ¡

Ø other ¡ques1ons, ¡ ¡please ¡email ¡to: ¡dbin@lbl.gov ¡ ¡

¡

PDSW2015: ¡10TH ¡Parallel ¡Data ¡Storage ¡Workshop, ¡Aus;n, ¡TX, ¡November ¡16, ¡2015 ¡

Read (Stripe Size: 64MB) Response Time (sec.) Probability 0.2 0.4 0.6 0.8 1.0 1.2 1.4 5 10 15 20