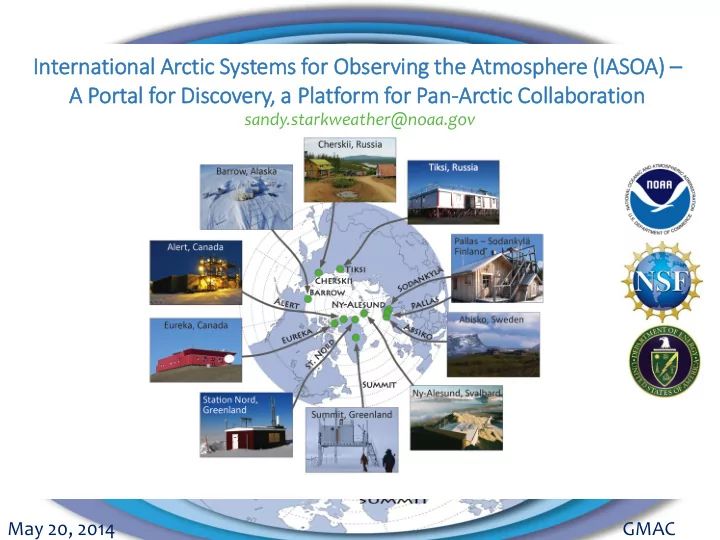
SLIDE 1 Inter ternational A Arctic S System ems f for O Obser erving t g the A e Atmospher ere e (IASOA) – A A Por
l for D Dis iscovery, a a Pla latform f for Pa Pan-Arctic ic C Collab labor
ion
sandy.starkweather@noaa.gov
May 20, 2014 GMAC
SLIDE 2
May 12, 2014 PSD-Flash May 20, 2014 GMAC
How & Why is the Arctic Changing? -> Integrate IASOA datasets and experts in sustained science collaborations
NCEP-NCAR Composite mean air temperature anomalies (1000mb); 2001-2012 compared to 1971- 2000. NOAA/ESRL – PSD. Image with help from B. DeLuisi & Cathy Smith
SLIDE 3
Integrating across Time, Geography and Process with Arctic Observatories
1000+ Datasets in Atmospheric Physics & Chemistry, Cryospheric, Ecological 10 Locations: Coastal, Estuary Continental, Ice Sheet, High Elev. Social Integration: Time Zones, Languages, Cultures, Expertise, National Needs & Priorities Records reaching back 30+ years
SLIDE 4
Image with help from – B. DeLuisi Web development – C. Kreuzter
SLIDE 5 Data Access Portal (cross-site inventory)
- Populated with structured, machine-readable
metadata
- Information organized in “IASOA context”
-------- Pan-Arctic, Ground-Based, Long-Term ------------- -------- Atm Physics, Chem, Surface -------------
SLIDE 6
Portal Population (800+ metadata files)
(~400) Harvested from major archives (as is) (~200) Working with archives on structure (~200) Hand Authored
SLIDE 7
SLIDE 8
4 Search Results
SLIDE 9
Emphasize Attribution
SLIDE 10
Emphasize Access
SLIDE 11
World Data Center Contributions
SLIDE 12
GMD Data Finder
SLIDE 13 Alert 2 m Eureka 10 m Tiksi 20 m Ny-Alesund 30 m Summit, Greenland 50 m Cherskii 35 m
Images courtesy T. Uttal, R. Albee, M. Okraszewski
- Identify interests and gaps
- Identify observing systems
& datasets of interest
- Identify collaborators and
experts
approaches to data processesing (e.g. GAW)
estimates
SLIDE 14
challenges
into account (e.g. exceptionally clean air, frost and rime)
improve network fitness
May 20, 2014 GMAC Images courtesy Rob Albee
SLIDE 15 Images courtesy C. Cox and N. Miller. Data: NOAA, NSF-ICECAPS, ETH, DOE-ARM. Rob Albee.
Comparison between historical radiometers and new NOAA suite revealed error
- issues. Large
- bservatories have
a lot of diagnostic tools, e.g. AERI
SLIDE 16 May 20, 2014 GMAC
synthesize
metadata
new questions, diversified expertise (e.g. cal-val)
Image courtesy B. Stone
SLIDE 17 May 12, 2014 PSD-Flash May 20, 2014 GMAC
IASOA Portal and Collaboration Summary
- Data is discoverable and accessible
with machine-readable metadata
- Highly leveraging existing networks
- Reliant on humans to maintain &
improve data/metadata
- “Collaboratory” Cycle – Context
provides impetus
- Benefits improved network fitness
SLIDE 18
THANK YOU. Questions?