
SLIDE 1
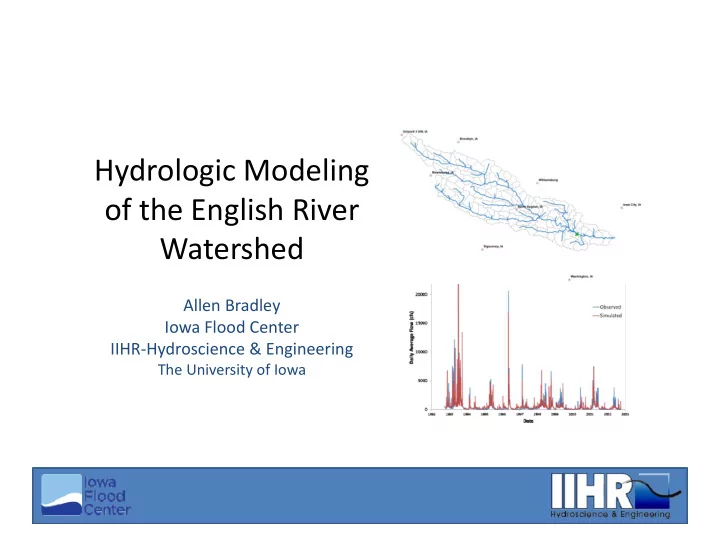
Hydrologic Modeling
- f the English River
Watershed
Allen Bradley Iowa Flood Center IIHR‐Hydroscience & Engineering
The University of Iowa
Hydrologic Modeling of the English River Watershed Allen Bradley - - PowerPoint PPT Presentation
Hydrologic Modeling of the English River Watershed Allen Bradley Iowa Flood Center IIHR Hydroscience & Engineering The University of Iowa We will assess the water cycle and flooding from model predictions Identification of high runoff and
Allen Bradley Iowa Flood Center IIHR‐Hydroscience & Engineering
The University of Iowa
Identification
and high flood areas Examples of hypothetical watershed scenarios The use of model predictions in interpreting water quality sampling
Hydrologic Modeling of the English River Watershed
Application to the English River Watershed
The average size of each river reach is about 6.1 mi2 HSPF performs a long‐term continuous hourly simulation of watershed hydrology
Application to the English River Watershed
2013 Land Use Information (Iowa Soybean Association) Pervious Land Segments: 56 (7×8) Impervious Land Segments: 16 (2×8) HSPF performs a long‐term continuous hourly simulation of watershed hydrology
Hydrologic Modeling of the English River Watershed
Areas with the highest runoff fractions are primarily a result of land use
Average annual runoff depth from the 64‐year simulation
Lower Runoff Areas Higher Runoff Areas Medium Runoff Areas
Higher runoff areas should be a priority for practices aimed at increasing infiltration
Mean annual flood from the 64‐year simulation
Lower Floods Higher Floods Medium Floods
Higher flood areas should be a priority for evaluating the effects
Hydrologic Modeling of the English River Watershed
Alternative Land Use in the English River Watershed
Assume existing row crops are replaced with tall‐grass prairie Deep rooted vegetations allow more water to infiltrate more quickly, and transpire more water Existing Land Use Scenario Land Use Pre‐settlement Tall‐grass prairie scenario
Alternative Land Use in the English River Watershed
Assume existing croplands have full implementation of conservation best management practices Assume best runoff conditions for cropland areas Existing Land Use Scenario Land Use Agricultural best management practices scenario
Flood Storage in the English River Watershed
Assume that 124 prototype ponds are installed in headwater reaches (1 pond per 2 square miles) Flood Storage Scenario Small (3‐foot) 10.9 acre‐feet Medium (5‐foot) 26.7 acre‐feet Large (7‐foot) 48.2 acre‐feet
Scenario effects on runoff
The average annual runoff depth is 8.3 inches (a 27% reduction) Tall‐grass Prairie Scenario
Prairie scenario runoff
Scenario effects on runoff
The average annual runoff depth is 8.3 inches (a 27% reduction) Tall‐grass Prairie Scenario The average annual runoff depth is 10.8 inches (a 5% reduction) Agricultural Management Scenario
Prairie scenario runoff Agricultural management runoff
Scenario effects on runoff
The average annual runoff depth is 8.3 inches (a 27% reduction) Tall‐grass Prairie Scenario The average annual runoff depth is 10.8 inches (a 5% reduction) Agricultural Management Scenario The average annual runoff depth is 11.3 inches (no reduction) Flood Pond Scenario
Scenario effects on flooding
Scenario effects on flooding
Scenario effects on flooding
Hydrologic Modeling of the English River Watershed
Current Conditions (Baseline)
Iowa Soybean Association (2014)
ERW2 ERW4
Nitrate Snapshot for 17 July 2014
Some sites are anomalously high compared to model predictions
ERW2
Nitrate Snapshot for 21 October 2014
Some sites are anomalously high compared to model predictions
ERW5 ERW4
Model predictions provide a valuable context for interpreting measurements
Hydrologic Modeling of the English River Watershed
Land use changes can have significant impacts on runoff and flooding. Flood storage can be targeted to reduce runoff effects for large floods. Model predictions were used to identify high runoff areas (a priority for practices) and high flood areas (a focus for assessing the impacts of practices). Model predictions of water quality can help us make sense of field measurements.
2/20/2015