SLIDE 1
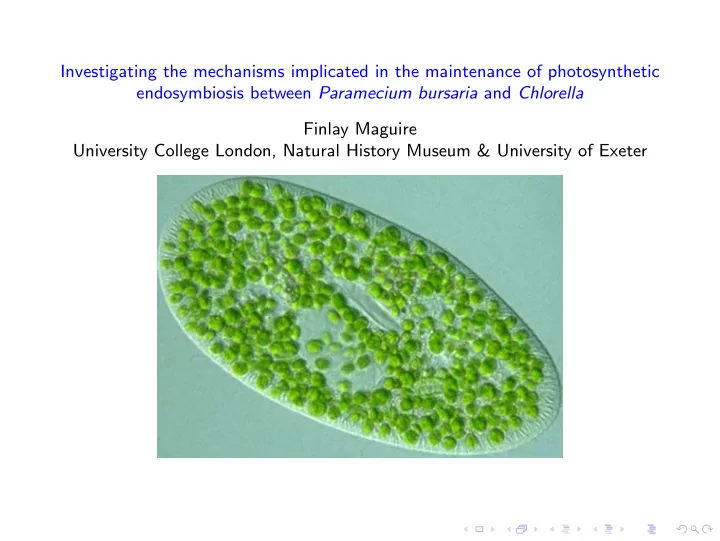
Investigating the mechanisms implicated in the maintenance of photosynthetic endosymbiosis between Paramecium bursaria and Chlorella Finlay Maguire University College London, Natural History Museum & University of Exeter
SLIDE 2
Background Biology
◮ Putatively facultative photosynthetic endosymbiosis between Paramecium
bursaria, a ciliate, and Chlorella, a green algae
◮ One of the earliest studied micro-organisms (figure illustrated by Otto
Muller in 1773)
◮ Complex, multi-factor relationship (on top of pure energetics: predation,
photoprotection, thermotolerance, exploitation of low oxygen environments etc.)
◮ Theoretically forms and interesting and tractable system to study
endosymbiosis before metabolic co-dependence becomes fixed
SLIDE 3
Transcriptomics on the system
◮ Day and night bulk RNA-Seq ◮ De-novo total assembly (pooled reads followed by remapping) ◮ Multiple assemblers and parameters used ◮ Referenced assemblies (Coccomyxa) but applicability of references requires
fine-scale endosymbiont and host identification Assembly Metric Oases Assembly Trinity Assembly Min Contig Length: 100 201 Max Contig Length: 16,202 17,729 Mean Contig Length: 648.90 959.32 Standard Deviation of Contig Length: 939.04 1080 N50 Contig Length: 1,368 1,621 Number of Contigs: 117,570 48,003 Number of Contigs ≥1kb: 22,225 14,774 Number of Contigs in N50: 14,977 8,060 Number of Bases in All Contigs: 76,290,606 46,050,097 Number of Bases in All Contigs ≥1kb: 46,695,005 31,602,626 GC Content of Contigs: 28.99% 30.97%
SLIDE 4
Confirming the identity of the host/endosymbiont
◮ rRNA fragments from within the transcriptome ◮ ITS2 sequencing ◮ ML and Bayesian phylogenetics ◮ Concluding: Referenced host assembly not applicable (not shown) but
host (Paramecium bursaria) relatively distance, including 2 whole genome duplications from closest genome (Paramecium tetraurelia)
SLIDE 5
Identifying transcript origin: problem formulation
◮ Metatranscriptome problem - most solutions geared towards environmental
studies
◮ Diverse transcript origins (e.g. bacterial food sequences, other potential
contaminants, as well as host and endosymbiont)
◮ Existing small-scale methods use relatively crude measures e.g. CDS
calling, GC%, BLAST
◮ We tested how well these type of measures perform compared to manually
evaluated phylogenies
SLIDE 6
Automated high-throughput transcript identification tool
SLIDE 7 Parallelised automated phylogeny generation and parsing
◮ Running using coarse parallelism (each transcript being processed using an
individual node not requiring shared memory) - ‘supermarket queue’
◮ Approximately 35% faster than serial multi-threaded execution of each step ◮ For each transcript:
◮ BLAST against curated database of 900 genomes ◮ Align recovered sequences using MUSCLE ◮ Automatically mask using TrimAL ◮ Generate rapid maximum-likelihood phylogenies using FastTree2
◮ Once each phylogeny has been generated they can be parsed ◮ If categories have been decided vectors can be generated:
◮ Parse each phylogeny using ETE2 and recover N-nearest neighbours to
transcript in phylogeny
◮ Using the NCBI taxonomy API determine taxonomy and categorisation of
these neighbours
◮ Sum the reciprocal total distance for each category within the N-neighbours ◮ i.e. For the i-th phylogeny the j-th parameter in its feature vector will be
1 n
p=1 Xp where Xp corresponds to the tree distance between the transcript
and the p-th neighbour (for the n ⊆ N neighbours s.t. n ∈ to the appropriate category).
SLIDE 8 Support Vector Machines
◮ Linear
classification:
◮ Maximum
margin solution + regularisation
◮ Non-linear
classification:
◮ Kernel
functions (map to feature space)
◮ Multi-class classification (e.g. ’Endosymbiont’, ’Host’, ’Food’,
’Unknown’):
◮ One-vs-all ◮ In-built
SLIDE 9
Assessing SVM function
◮ Optimise C and θ ◮ Error analysis ◮ Learning curves (Variance vs Bias) ◮ Precision (proportion of returned results that are relevant) / Recall
(proportion of relevant results returned) (F1 Score)
SLIDE 10
Anomaly detection
◮ Generate multivariate Gaussians for each category (using labelled data) ◮ Assign a threshold ǫ ◮ If P(X) ≤ ǫ for each Gaussian then flag input at potentially anomalous ◮ Manually investigate the anomalies ◮ Tweak ǫ to maximise TP while secondarily minimising FP
SLIDE 11
Beginning metabolic reconstruction
◮ Use the transcripts as partitioned into host and endosymbiont origin to
map onto KEGG metabolic networks
◮ GO and KO annotation of transcripts ◮ Combine KEGG modelling with differential expression data and known
literature to identify putative candidates involved in the maintenance of the endosymbiosis
SLIDE 12 Evidence supporting theoretical model
◮ Figure adapted from [Kato & Imamura, 2009] ◮ Putatively differentially expressed
◮ 6 endosymbiont sugar transporters putatively differentially up-regulated ◮ 4 host cation transporters (K +, Ca2+, Mg2+) ◮ 2 endosymbiont cation transporters (Ca2+, K +)
SLIDE 13 Summary
◮ Creation of an effective tool in resolving a key problem in multi-member
transcriptome analyses
◮ Mapping and evaluating a complex data source in exploratory analysis ◮ Make predictions of key candidates for further investigation (still
improving)
◮ Molecular validation of models and candidate proteins (in progress):
◮ Validate these predictions as having a role via RNAi ◮ System tested using Bug22 marker with mixed success ◮ Confirm differential expression (single cell transcriptomes/qPCR)