
SLIDE 1
Page 1 Liberty International 2009 Interim Results
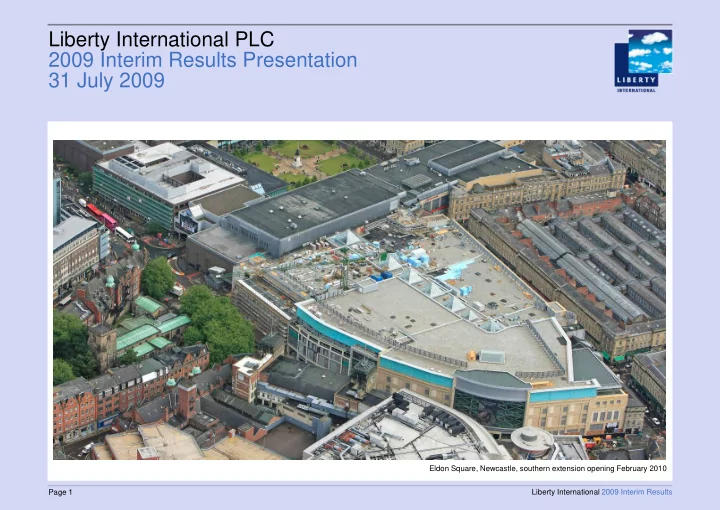
Liberty International PLC 2009 Interim Results Presentation 31 July 2009
Eldon Square, Newcastle, southern extension opening February 2010
Liberty International PLC 2009 Interim Results Presentation 31 July - - PowerPoint PPT Presentation
Liberty International PLC 2009 Interim Results Presentation 31 July 2009 Eldon Square, Newcastle, southern extension opening February 2010 Page 1 Liberty International 2009 Interim Results Important Notice This presentation includes
Page 1 Liberty International 2009 Interim Results
Eldon Square, Newcastle, southern extension opening February 2010
Page 2 Liberty International 2009 Interim Results
Page 3 Liberty International 2009 Interim Results
Page 4 Liberty International 2009 Interim Results
Page 5 Liberty International 2009 Interim Results
Page 6 Liberty International 2009 Interim Results
CSC capital value C&C UK capital value C&C USA capital value IPD monthly all property, capital value index
Page 7 Liberty International 2009 Interim Results
St David’s 2, Cardiff
Page 8 Liberty International 2009 Interim Results
Page 9 Liberty International 2009 Interim Results
Page 10 Liberty International 2009 Interim Results
10 20 30 40 50 60 70 First half 2008 CSC net rental income C&C net rental income Other income Administration costs Net finance costs First half 2009 £'M
Page 11 Liberty International 2009 Interim Results
Page 12 Liberty International 2009 Interim Results
(105p) (147p) (11p) (57p) 745p 448p 9p 493p 4p 10p
100 200 300 400 500 600 700 800 31 Dec 2008 Valuation deficit Q1 Capital raising Proforma Underlying profit Valuation deficit Q2 Other 'non-
Taxation Minority interest 30 Jun 2009 pence
Page 13 Liberty International 2009 Interim Results
Page 14 Liberty International 2009 Interim Results
50 100 150 200 250 2009 2010 2011 Total
Year £m
Page 15 Liberty International 2009 Interim Results
Page 16 Liberty International 2009 Interim Results
Page 17 Liberty International 2009 Interim Results
(14) (23) (22) (41) (105) (217) (358) (500) (400) (300) (200) (100) 1 2 3 - 5 6 - 10 11 - 15 16 - 20 21 - 25 26 - 30 Time Periods (Years)
Estimated Carrying Value (£m)
Page 18 Liberty International 2009 Interim Results
Page 19 Liberty International 2009 Interim Results
Page 20 Liberty International 2009 Interim Results
Page 21 Liberty International 2009 Interim Results
Page 22 Liberty International 2009 Interim Results
Page 23 Liberty International 2009 Interim Results
0.0% 2.0% 4.0% 6.0% 8.0% 10.0% 12.0% In admin, not relet at 31- Dec-08 Failures Q1 Failures Q2 Relet or under offer In admin, not relet at 30- Jun-09
% of rent
Occupied, including relet or under offer Occupied by administrator - not yet relet True void
0% 10% 20% 30% 40% 50% 60% 70% 80% 90% 100% Dec-07 Jun-08 Dec-08 Jun-09 % of rent
Page 24 Liberty International 2009 Interim Results
Page 25 Liberty International 2009 Interim Results
Page 26 Liberty International 2009 Interim Results
Page 27 Liberty International 2009 Interim Results
Cribbs Causeway, food area M&S Kitchen, Brompton Walk - Lakeside
Page 28 Liberty International 2009 Interim Results
National Story Telling Day (Lakeside) National Men’s Health Week (MetroCentre) National Family Week – Family Sports Day (Chapelfield) World Record Attempt for Largest Family Picnic (Victoria Centre)
Page 29 Liberty International 2009 Interim Results
Page 30 Liberty International 2009 Interim Results
King Street – Public realm and tenant re-engineering Bedford Chambers (artist’s impression)
Page 31 Liberty International 2009 Interim Results
Page 32 Liberty International 2009 Interim Results
Page 33 Liberty International 2009 Interim Results
Page 34 Liberty International 2009 Interim Results
Eldon Square, Newcastle, southern extension opening February 2010
Page 35 Liberty International 2009 Interim Results
Liberty International 2009 Interim Results Page 36
CSC Hammerson PruPIM Morley Land Sec Westfield Hermes Henderson Standard Life Grosvenor GIC Lend Lease Legal & General British Land USS
Source: PMA 2009
Liberty International 2009 Interim Results Page 37
Liberty International 2009 Interim Results Page 38
(6) (20) 49 20 352 264 9 1 35
200 210 220 230 240 250 260 270 280 290 300 310 320 330 340 350 360 370 380 390 400
Passing Rent Other Income Historic reviews Redevelopments Contracted uplifts, future rent reviews & expiries Vacancies Non recoverable costs Over-rented ERV
£m
Excludes all leases with tenants in administration Eldon Square and MetroCentre Includes £6m contracted on expiry of rent free periods includes 104 units under offer
Liberty International 2009 Interim Results Page 39
Liberty International 2009 Interim Results Page 40
Rank Tenant group % of rent 1. Arcadia 5% 2. Metropolitan Police 4% 3. Boots 3% 4. Next 3% 5. Monsoon Accessorize 2% Top 5 Tenants Total 16%
Rank Tenant group No of % of units rent 1. Arcadia 45 5% 2. Boots 17 3% 3. Next 19 3% 4. HMV 20 2% 5. Primark 8 2% 6. Monsoon Accessorize 25 2% 7. H&M 11 2% 8. DSG 12 2% 9. New Look 12 2% 10. Sports World 13 2% 11. Clinton Cards 21 2% 12. River Island 12 2% 13. W H Smith 11 2% 14. House of Fraser 4 2% 15. Bhs 9 2% 16. Signet 25 1% 17. Debenhams 5 1% 18. JD Sports 12 1% 19. Superdrug 10 1% 20. Clarks 13 1% Top 20 Tenants Total 304 40%
Liberty International 2009 Interim Results Page 41
£0 £50,000 £100,000 £150,000 £200,000 £250,000 £300,000 £350,000 2003 2004 2005 2006 2007 2008 2009 2010 2011 2012 0.00% 10.00% 20.00% 30.00% 40.00% 50.00% 60.00% 70.00% 80.00% 90.00% 100.00% Value Of Online E-Retail Spend (£Mn) % Online E-Retail Spend Of All Retail Spend
Source: Verdict
Liberty International 2009 Interim Results Page 42
0% 1% 2% 3% 4% 5% 6% 7% 8% 9% 10%
1994 1995 1996 1997 1998 1999 2000 2001 2002 2003 2004 2005 2006 2007 2008 Jun-09
YIELD
Dividend yield All Share Weighted average nominal equivalent yield CSC Gilts 15 years IPD Monthly Index Retail
Page 43 Liberty International 2009 Interim Results
100 200 300 400 500 600 700 800 900 1000 2009 2010 2011 2012 2013 2014 2015 2016 2017 2018 2019 2020 2021 2022 2023 2024 2025 2026 2027 £m
Lakeside CMBS July 2011 Convertible Bond Sept 2010 Earls Court Covent Garden, GCP, Empress State MetroCentre, Braehead, Watford CMBS Bromley, Uxbridge, Nottingham, Chapelfield Covent Garden C&C Debenture
Page 44 Liberty International 2009 Interim Results
Page 45 Liberty International 2009 Interim Results
Page 46 Liberty International 2009 Interim Results
Group as MetroCentre Earls Court Empress Proportional Reported Partnership & Olympia State consolidation 100% 40% 50% 50% £m £m £m £m £m Investment property 6,062 293 168 94 5,507 Cash 568 1 4 3 560 Other net current liabilities (537) (27) (56) (10) (444) Gross debt (4,083) (267) (113) (79) (3,624) Other non-current net assets 91
Net assets 2,101
8 2,091
Group as MetroCentre Earls Court Empress Proportional Reported Partnership & Olympia State consolidation 100% 40% 50% 50% £m £m £m £m £m Net rental income 190 10 8 3 169 Other income 1
Administration expenses (22)
Net finance costs (120) (12) (5) (3) (100) Underlying profit before tax 49 (2) 2
Valuation and exceptional items (501) (5) (16) (4) (476) Taxation (43)
Net loss for the period (495) (7) (14) (4) (470)
Page 47 Liberty International 2009 Interim Results
Page 48 Liberty International 2009 Interim Results
Gordon Family South Africa Institutions UK Institutions USA Continental Europe Singapore Australia Crest (Market making/Stock lending) Individuals etc.
16.3% 20.6% 23.2% 12.9% 7.7% 3.6% 2.0% 3.4% 10.3%
21.7% 16.9% 18.6% 7.8% 8.2% 5.2% 2.9% 4.2% 14.6%