
SLIDE 1
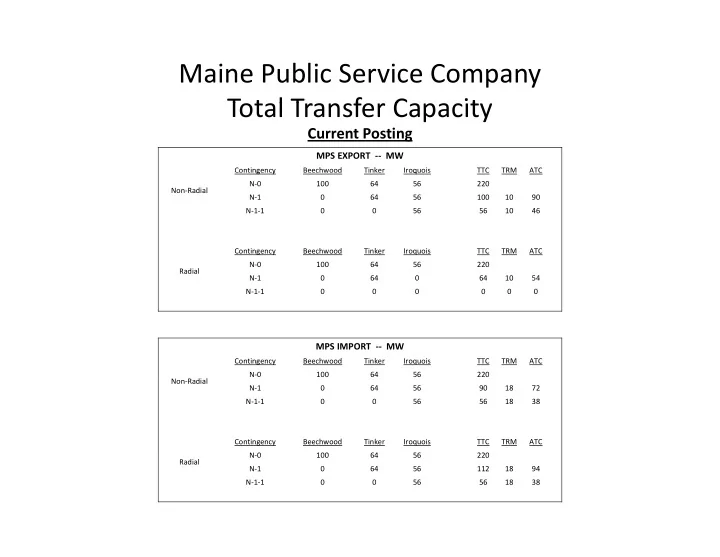
Maine Public Service Company T t l T f C it Total Transfer Capacity
Current Posting
MPS EXPORT ‐‐ MW
Contingency Beechwood Tinker Iroquois TTC TRM ATC Non‐Radial g y q N‐0 100 64 56 220 N‐1 64 56 100 10 90 N‐1‐1 56 56 10 46 Radial Contingency Beechwood Tinker Iroquois TTC TRM ATC N‐0 100 64 56 220 N‐1 64 64 10 54 N‐1‐1
MPS IMPORT ‐‐ MW
Non‐Radial Contingency Beechwood Tinker Iroquois TTC TRM ATC N‐0 100 64 56 220 Non Radial N‐1 64 56 90 18 72 N‐1‐1 56 56 18 38 Contingency Beechwood Tinker Iroquois TTC TRM ATC N 0 100 64 56 220 Radial N‐0 100 64 56 220 N‐1 64 56 112 18 94 N‐1‐1 56 56 18 38