
SLIDE 1
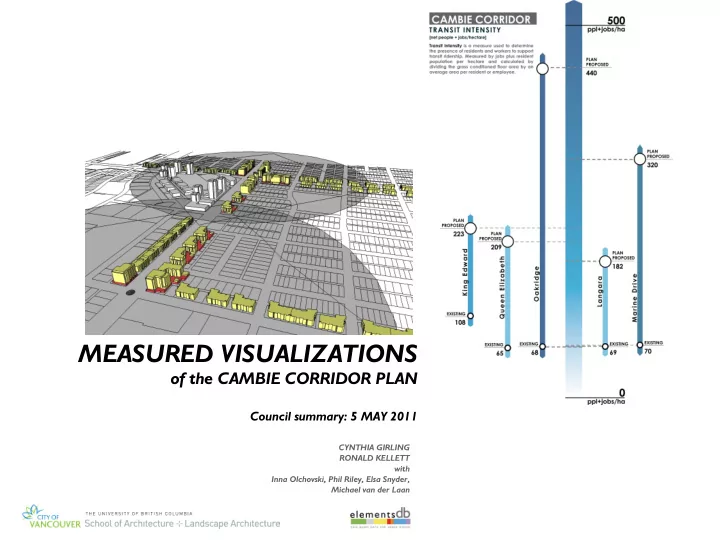
MEASURED VISUALIZATIONS
- f the CAMBIE CORRIDOR PLAN
Council summary: 5 MAY 2011
CYNTHIA GIRLING RONALD KELLETT with Inna Olchovski, Phil Riley, Elsa Snyder, Michael van der Laan
MEASURED VISUALIZATIONS of the CAMBIE CORRIDOR PLAN Council - - PowerPoint PPT Presentation
MEASURED VISUALIZATIONS of the CAMBIE CORRIDOR PLAN Council summary: 5 MAY 2011 CYNTHIA GIRLING RONALD KELLETT with Inna Olchovski, Phil Riley, Elsa Snyder, Michael van der Laan We create tools and methods to inform urban planning
Council summary: 5 MAY 2011
CYNTHIA GIRLING RONALD KELLETT with Inna Olchovski, Phil Riley, Elsa Snyder, Michael van der Laan
highrise midrise
attached detached
Cambie Corridor: contemplated land use/building heights City of Vancouver Planning, May 2010
Oakridge Policy Document 3 dwellings per parcel average
Reference points
Existing condition in pictures and numbers Proposed condition in pictures and numbers Relative change to study area
Reference points
Existing condition in pictures and numbers Proposed condition in pictures and numbers Relative change to study area Whole corridor reference scale
measures residential land use intensity in net units per hectare(estimated number of dwelling units divided by land area exclusive of street rights of way)
*Langara excludes significant pending off- corridor development ** Marine Drive study area includes significant non-residential land uses
measures development intensity in average FAR (estimated conditioned floor area divided by parcel area — only on corridor parcels)
measures the number of residents and jobs (estimated population and jobs within 500m of Cambie)
measures heat energy density (space heating and hot water per hectare) — an indicator of community energy system potential
Council summary: 5 MAY 2011
CYNTHIA GIRLING RONALD KELLETT with Inna Olchovski, Phil Riley, Elsa Snyder, Michael van der Laan