
SLIDE 1
Measurement of Free Volume in Polyethylene Terephthalate Using Positron Annihilation Lifetime Spectroscopy
Chaewon Lee a, b, Wonjin Kim a, b, Jaegi Lee a*, Young Rang Uhm a, Gwang-Min Sun a
aKorea Atomic Energy Research Institute, Daejeon, Republic of Korea, 34057 bDepartment of NanoPhysics, Gachon University, 1342 Seongnamdaero, Sujeong-gu, Seongnam-si, Gyeonggi-do,
Republic of Korea, 21936 Corresponding author: jgl@kaeri.re.kr
- 1. Introduction
Positrons annihilate with electrons in materials, and emit pairs of gamma-rays. Positron annihilation spectroscopy (PAS) is sensitive to detect defects in metals or semiconductors, and widely used to calculate the free volume of polymers. Among several PAS methods, positron annihilation lifetime spectroscopy (PALS) measures the size and amount of defects or free volume by measuring the time difference between gamma-ray from positron generating isotope and annihilation gamma-ray. Positrons injecting into the materials form positronium (Ps) with electrons. It has previously been reported that Ps can be classified into p-Ps (antiparallel spins, para positronium) and o-Ps (parallel spins, ortho positronium) depending on the electron and positron spin [1]. p-Ps has a short lifetime
- f τ ≈ 0.125 ns. o-Ps disappears with peripheral electrons
belonging to pick-off annihilation, emits gamma-rays, and has a lifetime component of τ ≈ 1~5 ns. According to Buttafava et al. [2], correlation between the size of the free volume and the lifetime of o-Ps can be modeled and expressed quantitatively. In this study, we determined the lifetime component of o-Ps and analyzed the tendency of the free volume with the change of the thickness of polyethylene terephthalate (PET).
- 2. Materials and Methods
The PALS system in Korea Atomic Energy Research Institute (KAERI) was used to measure positron lifetime components (Fig. 1 (a)). The positron source, 22Na (activity 30 μCi) with a hydrogen chloride solution was dried on a Ni foil (thickness 2.5 mm). The
22Na + Ni foil was sandwiched between the PET samples.
The PET films with the different thickness of 570, 210, 80, 50, and 12 μm were used to analyze the free volume. Each PET film was cut in small pieces, similar size of the positron source. The samples were measured by
- verlapping each of them, with 2 sheets of 570 μm, 4
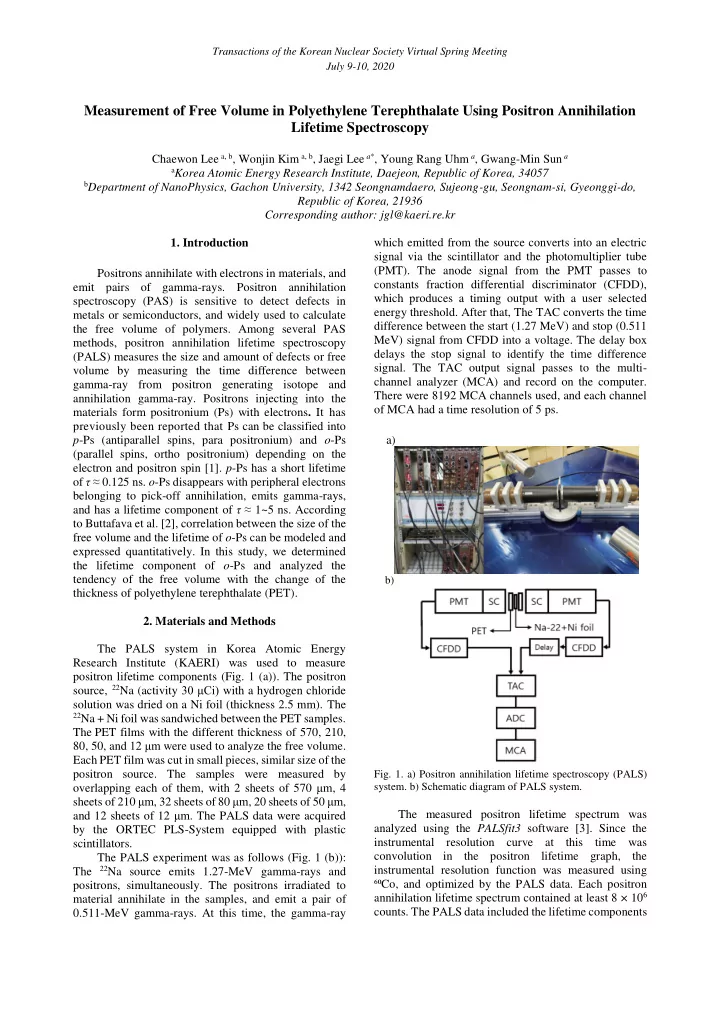
sheets of 210 μm, 32 sheets of 80 μm, 20 sheets of 50 μm, and 12 sheets of 12 μm. The PALS data were acquired by the ORTEC PLS-System equipped with plastic scintillators. The PALS experiment was as follows (Fig. 1 (b)): The 22Na source emits 1.27-MeV gamma-rays and positrons, simultaneously. The positrons irradiated to material annihilate in the samples, and emit a pair of 0.511-MeV gamma-rays. At this time, the gamma-ray which emitted from the source converts into an electric signal via the scintillator and the photomultiplier tube (PMT). The anode signal from the PMT passes to constants fraction differential discriminator (CFDD), which produces a timing output with a user selected energy threshold. After that, The TAC converts the time difference between the start (1.27 MeV) and stop (0.511 MeV) signal from CFDD into a voltage. The delay box delays the stop signal to identify the time difference
- signal. The TAC output signal passes to the multi-
channel analyzer (MCA) and record on the computer. There were 8192 MCA channels used, and each channel
- f MCA had a time resolution of 5 ps.
a)
b)
- Fig. 1. a) Positron annihilation lifetime spectroscopy (PALS)
- system. b) Schematic diagram of PALS system.
The measured positron lifetime spectrum was analyzed using the PALSfit3 software [3]. Since the instrumental resolution curve at this time was convolution in the positron lifetime graph, the instrumental resolution function was measured using ⁶⁰Co, and optimized by the PALS data. Each positron annihilation lifetime spectrum contained at least 8 × 10⁶
- counts. The PALS data included the lifetime components