Moisture content control by shrinkage behaviour of the wood first - - PowerPoint PPT Presentation

moisture content control by shrinkage behaviour of the
SMART_READER_LITE
LIVE PREVIEW

Moisture content control by shrinkage behaviour of the wood first - - PowerPoint PPT Presentation

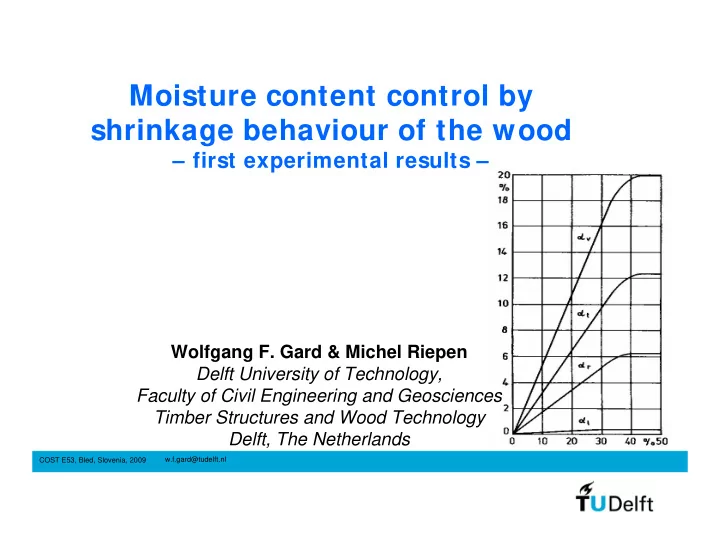
Moisture content control by shrinkage behaviour of the wood first experimental results Wolfgang F. Gard & Michel Riepen Delft University of Technology, Faculty of Civil Engineering and Geosciences Timber Structures and Wood


slide-1
SLIDE 1

w.f.gard@tudelft.nl COST E53, Bled, Slovenia, 2009

Moisture content control by shrinkage behaviour of the wood

– first experimental results –

Wolfgang F. Gard & Michel Riepen Delft University of Technology, Faculty of Civil Engineering and Geosciences Timber Structures and Wood Technology Delft, The Netherlands

slide-2
SLIDE 2

w.f.gard@tudelft.nl

2

COST E53, Bled, Slovenia, 2009

Content

  • Introduction
  • Drying trials: material and method
  • Results
  • Conclusion
slide-3
SLIDE 3

w.f.gard@tudelft.nl

4

COST E53, Bled, Slovenia, 2009

I ntroduction

Why would you like to control a drying process ?

  • To obtain the final moisture content
  • To avoid cracks, distortions and discoloration
slide-4
SLIDE 4

w.f.gard@tudelft.nl

5

COST E53, Bled, Slovenia, 2009

I ntroduction

How do you control a drying process ?

  • Moisture content measurements
  • Moisture evaporation rate (drying rate)
  • Strain measurements

Along the cross-section of the timber !!!!!!!!!

slide-5
SLIDE 5

w.f.gard@tudelft.nl

6

COST E53, Bled, Slovenia, 2009

I ntroduction

Common inline measurement systems for moisture content in a kiln ?

  • Electrical resistance probes
  • Exceptionally: weighing the stack
  • ?????????

Prediction of water evaporation and moisture content by drying models !!!!!!

slide-6
SLIDE 6

w.f.gard@tudelft.nl

7

COST E53, Bled, Slovenia, 2009

I ntroduction

Limitations of electrical resistance measurements ?

  • Moisture content above fibre saturation
  • Temperature above 80°C
slide-7
SLIDE 7

w.f.gard@tudelft.nl

8

COST E53, Bled, Slovenia, 2009

I ntroduction

What about shrinkage ? There is also a relationship between shrinkage and moisture content.

slide-8
SLIDE 8

w.f.gard@tudelft.nl

10

COST E53, Bled, Slovenia, 2009

Drying trial

Material

  • Sitka Spruce from Scotland/UK
  • 2500mm x 100mm x 50mm
  • Initial moisture content 40% - 170%

(50% of all boards higher 90%)

  • Final moisture content required 15%±1
  • 63 boards per trial
slide-9
SLIDE 9

w.f.gard@tudelft.nl

11

COST E53, Bled, Slovenia, 2009

Drying trial

Sensors 6 moisture probes in the timber 2 temperature sensors in the timber 2 relative humidity sensors in the kiln 2 temperature sensors in the kiln 2 shrinkage sensors at the timber stack 2 load cells for weighing the stack

slide-10
SLIDE 10

w.f.gard@tudelft.nl

12

COST E53, Bled, Slovenia, 2009

Drying trial

  • Top load 500 kg/m2, to avoid

deformation during drying

  • Measuring online the decrease
  • f thickness with a displacement

sensor (LVDT)

  • Measuring the decrease of the

mass with a load cell

Timber stack

slide-11
SLIDE 11

w.f.gard@tudelft.nl

14

COST E53, Bled, Slovenia, 2009

Drying trial

Drying schedule

20 40 60 80 100 120 time T wet T dry r.H.

warming up cooling steam drying pre-drying conditioning

slide-12
SLIDE 12

w.f.gard@tudelft.nl

16

COST E53, Bled, Slovenia, 2009

Results

0.0 20.0 40.0 60.0 80.0 100.0 120.0 140.0 24 48 72 96 120 144 168 Time [h] T [°C], RH [%], MC [%]

Tair RH T wet T wood MC MC above FSP

slide-13
SLIDE 13

w.f.gard@tudelft.nl

17

COST E53, Bled, Slovenia, 2009

Results

  • 25.00
  • 22.50
  • 20.00
  • 17.50
  • 15.00
  • 12.50
  • 10.00
  • 7.50
  • 5.00
  • 2.50

0.00 24 48 72 96 120 144 168

time [h] displacement [mm]

290 310 330 350 370 390 410 430 450 470 490

mass [kg] Thickness decrease [mm] mass [kg]

In this period timber is above FSP, but shows linear thickness decrease proportional with mass decrease, due to evaporation.

slide-14
SLIDE 14

w.f.gard@tudelft.nl

18

COST E53, Bled, Slovenia, 2009

Results

Shrinkage parameters

  • total thickness of the boards 350mm in the

beginning of the drying

  • total thickness decrease 17.7mm total

shrinkage 5.0%

  • final moisture content 14.5% (oven dry)
  • assumed fibre saturation point 30%
  • derived shrinkage coefficient 0.50% per % MC

change

slide-15
SLIDE 15

w.f.gard@tudelft.nl

20

COST E53, Bled, Slovenia, 2009

Results

20 40 60 80 100 120 24 48 72 96 Time [h] T [°C], RH and MC [%]

  • 18
  • 15
  • 12
  • 9
  • 6
  • 3

Thickness decrease [mm] Tair T wet T wood MC wood MC shrink Thickness decrease

Sitka spruce on industrial scale

slide-16
SLIDE 16

w.f.gard@tudelft.nl

22

COST E53, Bled, Slovenia, 2009

Conclusion of the first results

  • With a displacement sensor we get information on the

drying rate, which is especially in the early drying stages

  • f Sitka very important for the drying quality.
  • Displacement measurements are reliable at high

temperatures (> 100°C).

  • There is a direct linear relation between thickness

decrease and mass decrease due to drying.

slide-17
SLIDE 17

w.f.gard@tudelft.nl COST E53, Bled, Slovenia, 2009

Thank you very much for your attention !