Motivation S T A T I S T I K A U S T R I A D i e I n f o r m a t - - PowerPoint PPT Presentation

▶
motivation
SMART_READER_LITE
LIVE PREVIEW

Motivation S T A T I S T I K A U S T R I A D i e I n f o r m a t - - PowerPoint PPT Presentation

Motivation S T A T I S T I K A U S T R I A D i e I n f o r m a t i o n s m a n a g e r EU-SILC poverty rates High quality indicators on national- but estimates on sub-national level have poor accuracy SAE-Methods modelling


slide-1
SLIDE 1

S T A T I S T I K A U S T R I A

D i e I n f o r m a t i o n s m a n a g e r

Motivation

◮

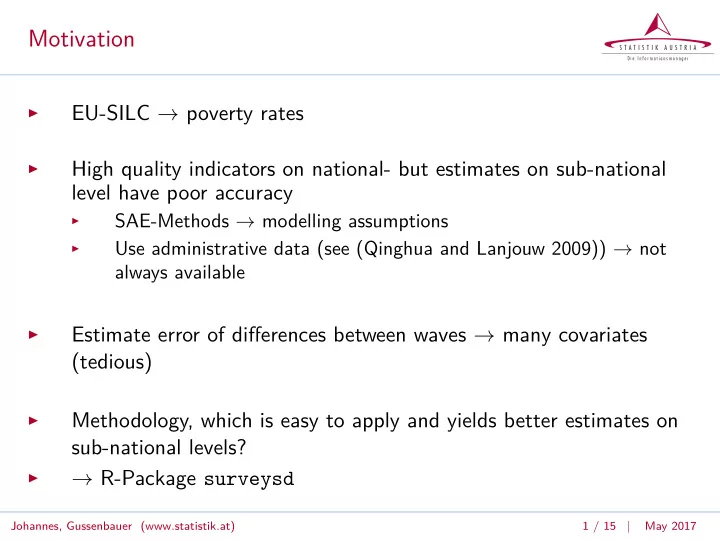
EU-SILC → poverty rates

◮

High quality indicators on national- but estimates on sub-national level have poor accuracy

◮

SAE-Methods → modelling assumptions

◮

Use administrative data (see (Qinghua and Lanjouw 2009)) → not always available

◮

Estimate error of differences between waves → many covariates (tedious)

◮

Methodology, which is easy to apply and yields better estimates on sub-national levels?

◮

→ R-Package surveysd

Johannes, Gussenbauer (www.statistik.at) 1 / 15 | May 2017

slide-2
SLIDE 2

S T A T I S T I K A U S T R I A

D i e I n f o r m a t i o n s m a n a g e r

Motivation

◮

EU-SILC → poverty rates

◮

High quality indicators on national- but estimates on sub-national level have poor accuracy

◮

SAE-Methods → modelling assumptions

◮

Use administrative data (see (Qinghua and Lanjouw 2009)) → not always available

◮

Estimate error of differences between waves → many covariates (tedious)

◮

Methodology, which is easy to apply and yields better estimates on sub-national levels?

◮

→ R-Package surveysd

Johannes, Gussenbauer (www.statistik.at) 2 / 15 | May 2017

slide-3
SLIDE 3

S T A T I S T I K A U S T R I A

D i e I n f o r m a t i o n s m a n a g e r

surveysd

◮

R-package for variance estimation on surveys with rotating panel design

◮

Variance estimation via bootstrap techniques

◮

Rescaled bootstrap for stratified multistage sampling (Preston, 2009)

◮

Improve accuracy by using multiple (consecutive) waves of the survey

◮

Average bootstrap replicates over waves (Betti et al., 2012)

◮

Easy to use, even for R-Beginners

Johannes, Gussenbauer (www.statistik.at) 3 / 15 | May 2017

slide-4
SLIDE 4

S T A T I S T I K A U S T R I A

D i e I n f o r m a t i o n s m a n a g e r

Main functionality

◮

Draw bootstrap replicates → draw.bootstrap()

◮

Calibrate bootstrap replicates → recalib()

◮

Estimate standard errors → calc.stError()

Johannes, Gussenbauer (www.statistik.at) 4 / 15 | May 2017

slide-5
SLIDE 5

S T A T I S T I K A U S T R I A

D i e I n f o r m a t i o n s m a n a g e r

Draw bootstrap replicates

draw.bootstrap(dat,REP=1000,hid="DB030",weights="RB050", year="RB010",strata="DB040",cluster=NULL, totals=NULL,single.PSU=c("merge","mean"), boot.names=NULL,country=NULL,split=FALSE,pid=NULL)

◮

Rectangular data set with household identifier

◮

Describe sampling design with strata and cluster

◮

Automatic detection and dealing with single PSUs

◮

Replicates are taken forward to mimic rotational panel design

◮

Split households are considered

Johannes, Gussenbauer (www.statistik.at) 5 / 15 | May 2017

slide-6
SLIDE 6

S T A T I S T I K A U S T R I A

D i e I n f o r m a t i o n s m a n a g e r

Draw bootstrap replicates

draw.bootstrap(dat,REP=1000,hid="DB030",weights="RB050", year="RB010",strata="DB040",cluster=NULL, totals=NULL,single.PSU=c("merge","mean"), boot.names=NULL,country=NULL,split=FALSE,pid=NULL)

◮

Rectangular data set with household identifier

◮

Describe sampling design with strata and cluster

◮

Automatic detection and dealing with single PSUs

◮

Replicates are taken forward to mimic rotational panel design

◮

Split households are considered

Johannes, Gussenbauer (www.statistik.at) 6 / 15 | May 2017

slide-7
SLIDE 7

S T A T I S T I K A U S T R I A

D i e I n f o r m a t i o n s m a n a g e r

Calibrate Bootsrap Replicates

recalib(dat,hid="DB030",weights="RB050", b.rep=paste0("w",1:1000),year="RB010", country=NULL,conP.var=c("RB090"), conH.var=c("DB040","DB100"),...)

◮

Calibration with ipu2() from Package simPop

◮

Define households and/or personal variables to be calibrated onto

Johannes, Gussenbauer (www.statistik.at) 7 / 15 | May 2017

slide-8
SLIDE 8

S T A T I S T I K A U S T R I A

D i e I n f o r m a t i o n s m a n a g e r

Estimate standard errors

calc.stError(dat,weights="RB050",b.weights=paste0("w",1:1000), year="RB010",var="HX080",fun="weightedRatio", cross_var=NULL,year.diff=NULL,year.mean=3,bias=FALSE, add.arg=NULL,size.limit=20,cv.limit=10,p=NULL)

◮

Use output of recalib() or rectangular data with bootstrap weights

◮

Function fun is applied on variable var using each bootstrap weight

◮

Predefined functions available, also able to handle custom functions

  • r functions from other packages

◮

Must return double or integer and second argument is weight

Johannes, Gussenbauer (www.statistik.at) 8 / 15 | May 2017

slide-9
SLIDE 9

S T A T I S T I K A U S T R I A

D i e I n f o r m a t i o n s m a n a g e r

Estimate standard errors

calc.stError(dat,weights="RB050",b.weights=paste0("w",1:1000), year="RB010",var="HX080",fun="weightedRatio", cross_var=NULL,year.diff=NULL,year.mean=3,bias=FALSE, add.arg=NULL,size.limit=20,cv.limit=10,p=NULL)

◮

Use output of recalib() or rectangular data with bootstrap weights.

◮

Function fun is applied on variable var using each bootstrap weight

◮

Predefined functions available, also able to handle custom functions

  • r functions from other packages

◮

Must return double or integer and second argument is weight

Johannes, Gussenbauer (www.statistik.at) 9 / 15 | May 2017

slide-10
SLIDE 10

S T A T I S T I K A U S T R I A

D i e I n f o r m a t i o n s m a n a g e r

Estimate standard errors

◮

Results of point estimates are averaged over year.mean years (optional)

◮

Apply filter with equal filter weights over time series

◮

Estimate standard errors for differences between waves with year.diff (optional)

◮

Estimate errors on subgroups with cross_var (optional)

◮

Estimate quantiles using parameter p

Johannes, Gussenbauer (www.statistik.at) 10 / 15 | May 2017

slide-11
SLIDE 11

S T A T I S T I K A U S T R I A

D i e I n f o r m a t i o n s m a n a g e r

Estimate standard errors

calc.stError(UDB_AT,weights="weights", year="year",b.weights=paste0("w",1:10), var="poverty",cross_var=list("region",c("gender","region"))) ## Calculated point estimates for variable(s) ## ## poverty ## ## using function weightedRatio ## ## Results hold 448 point estimates for 9 years in 28 subgroups ## ## Estimted standard error exceeds 10 % of the the point estimate in 246 cases

Johannes, Gussenbauer (www.statistik.at) 11 / 15 | May 2017

slide-12
SLIDE 12

S T A T I S T I K A U S T R I A

D i e I n f o r m a t i o n s m a n a g e r

Estimate standard errors

# Apply function which is not in package 'surveysd' # take the gini - index library(laeken,quietly=TRUE) # simulate income set.seed(1234) UDB_AT[,income:= exp(rnorm(.N,mean=sample(7:10,1),sd=1)), by=list(urban)] # gini() returns list # calc.stError needs function that returns double or integer help_gini <- function(x,w){ return(gini(x,w)$value) }

Johannes, Gussenbauer (www.statistik.at) 12 / 15 | May 2017

slide-13
SLIDE 13

S T A T I S T I K A U S T R I A

D i e I n f o r m a t i o n s m a n a g e r

Estimate standard errors

calc.stError(UDB_AT,fun="help_gini", weights="weights",year="year",b.weights=paste0("w",1:10), var="income",cross_var=list("region",c("gender","region")), year.diff=c("2014-2008"),p=c(.025,.975)) ## Calculated point estimates for variable(s) ## ## income ## ## using function help_gini from .GlobalEnv ## ## Results hold 504 point estimates for 9 years in 28 subgroups ## ## Estimted standard error exceeds 10 % of the the point estimate in 22 cases

Johannes, Gussenbauer (www.statistik.at) 13 / 15 | May 2017

slide-14
SLIDE 14

S T A T I S T I K A U S T R I A

D i e I n f o r m a t i o n s m a n a g e r

Plot Method

plot(res_inc,type="grouping", groups="region",sd.type="ribbon")

AT32 AT33 AT34 AT21 AT22 AT31 AT11 AT12 AT13 2 8 2 9 2 1 2 1 1 2 1 2 2 1 3 2 1 4 2 1 5 2 1 6 2 8 2 9 2 1 2 1 1 2 1 2 2 1 3 2 1 4 2 1 5 2 1 6 2 8 2 9 2 1 2 1 1 2 1 2 2 1 3 2 1 4 2 1 5 2 1 6 50 55 60 65 50 55 60 65 50 55 60 65

help_gini of income

Johannes, Gussenbauer (www.statistik.at) 14 / 15 | May 2017

slide-15
SLIDE 15

S T A T I S T I K A U S T R I A

D i e I n f o r m a t i o n s m a n a g e r

Final Remarks

◮

Simple to use R-Package

◮

Supports a harmonious approach for estimating standard errors on surveys with rotating panel design

◮

Achieve more accuracy by averaging over multiple years

◮

No need for administrative data or modelling assumptions

◮

Check it out on github: https://github.com/statistikat/surveysd

Johannes, Gussenbauer (www.statistik.at) 15 / 15 | May 2017