
SLIDE 1
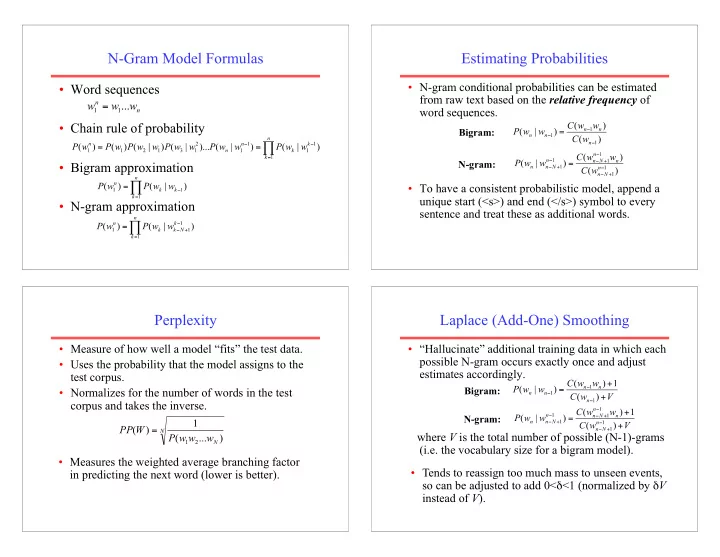
N-Gram Model Formulas
- Word sequences
- Chain rule of probability
- Bigram approximation
- N-gram approximation
Estimating Probabilities
- N-gram conditional probabilities can be estimated
from raw text based on the relative frequency of word sequences.
- To have a consistent probabilistic model, append a
unique start (<s>) and end (</s>) symbol to every sentence and treat these as additional words.
Bigram: N-gram:
Perplexity
- Measure of how well a model “fits” the test data.
- Uses the probability that the model assigns to the
test corpus.
- Normalizes for the number of words in the test
corpus and takes the inverse.
- Measures the weighted average branching factor
in predicting the next word (lower is better).
Laplace (Add-One) Smoothing
- “Hallucinate” additional training data in which each
possible N-gram occurs exactly once and adjust estimates accordingly. where V is the total number of possible (N-1)-grams (i.e. the vocabulary size for a bigram model).
Bigram: N-gram:
- Tends to reassign too much mass to unseen events,