) n k = x b 1 k L r ( ) ( ) Assumption: vi - - PowerPoint PPT Presentation

n k x b 1 k l r assumption vi vi with
SMART_READER_LITE
LIVE PREVIEW

) n k = x b 1 k L r ( ) ( ) Assumption: vi - - PowerPoint PPT Presentation

Model Equation Comparing Missing Values Handling Algorithms Observations: v = 1... n in the Context of the Rasch Model Items: i = 1... k Rainer W. Alexandrowicz ( ) ( ) x x ( ) e vi vi v i = = p x


slide-1
SLIDE 1

Comparing Missing Values Handling Algorithms in the Context of the Rasch Model

Alpen-Adria-Universität Klagenfurt, Institut für Psychologie, Abteilung für Angewandte Psychologie und Methodenforschung Universitätsstraße 65-67 9020 Klagenfurt Österreich rainer.alexandrowicz@uni-klu.ac.at

Rainer W. Alexandrowicz

( )

( )

( )

i v x i v x i v vi

vi i v i v vi

e e x p

ε ξ ε ξ β θ

β θ

β θ

+ = + =

1 1 ,

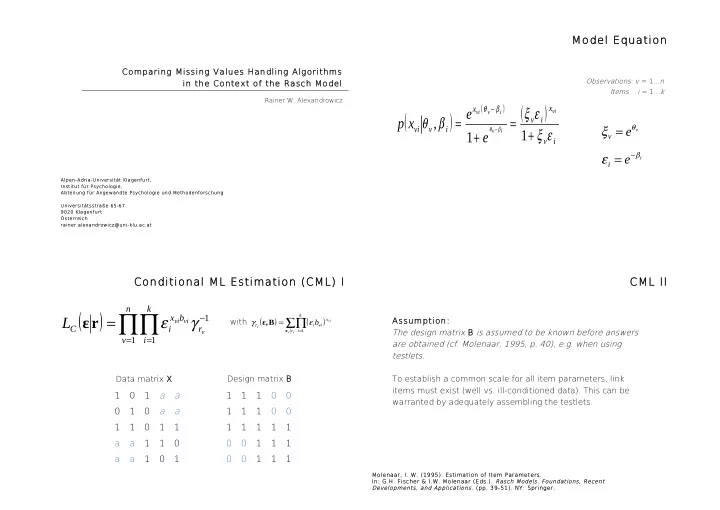
Observations: v = 1...n Items: i = 1...k

Model Equation

i v

e e

i v β θ

ε ξ

= =

Conditional ML Estimation (CML) I

( ) ∏∏

= = −

=

n v k i r b x i C

v vi vi

L

1 1 1

γ ε r ε

( ) ( )

∑∏

=

=

v v vi v

r k i x vi i r

b

x

B ε,

1

ε γ with

1 1 a a 1 a a 1 1 1 1 a a 1 1 a a 1 1 1 1 1 1 1 1 1 1 1 1 1 1 1 1 1 1 1

Data matrix X Design matrix B

CML II

Assumption: The design matrix B is assumed to be known before answers are obtained (cf. Molenaar, 1995, p. 40), e.g. when using testlets. To establish a common scale for all item parameters, link items must exist (well vs. ill-conditioned data). This can be warranted by adequately assembling the testlets.

Molenaar, I. W. (1995). Estimation of Item Parameters. In: G.H. Fischer & I.W. Molenaar (Eds.). Rasch Models. Foundations, Recent Developments, and Applications. (pp. 39-51). NY: Springer.

slide-2
SLIDE 2

Problem

Problem: Missing values appear in the course of testing, hence the assumption does not hold. Question: Is the design matrix B a valid means for handling missing values not known prior to data acquisition?

Method (i)

Simulation Study: Data sets conforming to the Rasch Model were generated and missingness was induced according to the taxonomy of Rubin (1976) [MCAR, MAR, NMAR]. Special focus: MCAR vs. NMAR: MCAR: a given percentage of values were deleted randomly across the data matrix NMAR: the probability of missingness was determined according to a 4PL-like model:

Rubin, D. B. (1976). Inference and missing data. Biometrika, 63, 581–592.

( )

( )

( )

b a i v vi

i v

e d c c d c b a m p

− −

+ − − + =

β θ

β θ 1 1 , , , , ,

+ Intermediate step: Use person parameter estimate as propensity to produce a missing value.

Method (ii)

p(missing|NMAR)

( )

( )

( )

b a i v vi

i v

e d c c d c b a m p

− −

+ − − + =

β θ

β θ 1 1 , , , , ,

  • 2
  • 1

1 2 0.0 0.2 0.4 0.6 0.8 1.0 c d βi + b a

Method (iii)

Missing Values Handling Methods 1) Treat as structural missings, i.e. pretend, they were never presented to the testee (involving B with zeros inserted where missing values occured). 2) Assume no answer given = no answer known; testee preferres to omit a question to taking the risk of a wrong answer. Missings are replaced by zeros. 3) Opposite to 2: Missing values are replaced by ones (e.g. because testee did not want to admit support of nuklear power plants or a right wing party in a survey; social desirability; ...). 4) Assume testee was, say, distracted, but would have been able to sometimes respond correctly and sometimes not; however, we do not know which. Missing values are replaced by 0 or 1 drawn randomly from a Bernoulli with p=.5 5) „Mean imputation“: Replace missings by draws from a Bernoulli with 6) „Model based imputation“: Replace missings by draws from a Bernoulli with (two step method).

[ ]

=

v

  • bs

vi i

x n p

.

1

( )

i v vi

p p β θ ˆ , ˆ + =

slide-3
SLIDE 3

Results (i)

MCAR – Item Bias

5 10 15 20

  • 0.3
  • 0.2
  • 0.1

0.0 0.1 0.2 0.3

Item Bias: k=20, n=1000

Item No. Bias

x x x x x x x x x x x x x x x x x x x x

  • r

r r r r r r r r r r r r r r r r r r r i i i i i i i i i i i i i i i i i i i i m m m m m m m m m m m m m m m m m m m m

increasing difficulty

Results (ii)

MCAR – LR Test

k=20; Original Values

x Density 14 16 18 20 22 24 26 28 0.00 0.02 0.04 0.06 0.08 0.10 0.12 0.14 k=20; Missing Values x Density 10 20 30 40 0.00 0.01 0.02 0.03 0.04 0.05 0.06

k=20; Zero Fill

x Density 10 20 30 40 0.00 0.01 0.02 0.03 0.04 0.05 0.06 0.07

Results (iii)

MCAR – LR Test

k=20; Random Fill

x Density 5 10 15 20 25 30 35 40 0.00 0.02 0.04 0.06 0.08 k=20; Item Mean Imputation x Density 10 20 30 40 0.00 0.01 0.02 0.03 0.04 0.05 0.06 k=20; Model Based Imputation x Density 10 15 20 25 30 35 40 0.00 0.02 0.04 0.06

Results (iv)

NMAR (1) – Item Bias

2 4 6 8 10

  • 0.4
  • 0.2

0.0 0.2 0.4

NMAR - Item Bias: k=10, n=1000

Item No. Bias

x x x x x x x x x x

  • r

r r r r r r r r r i i i i i i i i i i m m m m m m m m m m

slide-4
SLIDE 4

Results (v)

NMAR (1) – LR-Test

Original Values

x Density 5 10 15 0.00 0.05 0.10 0.15 0.20 0.25 0.30

Missing Values

x Density 5 10 15 0.00 0.05 0.10 0.15 0.20 0.25 0.30 Zero Fill x Density 5 10 15 0.00 0.05 0.10 0.15 0.20 0.25 0.30

k=5

Results (vi)

NMAR (1) – LR-Test

Random Fill

x Density 5 10 15 0.00 0.05 0.10 0.15 0.20 0.25 0.30

Item Mean Imputation

x Density 5 10 15 0.00 0.05 0.10 0.15 0.20 0.25 0.30 Model Based Imputation x Density 5 10 15 0.00 0.05 0.10 0.15 0.20 0.25 0.30

in fact: This principle is not NMAR!

Results (vii)

NMAR (2) – Item Bias

n=8000; k=10 NB: green = item mean;

Results (viii)

NMAR (2) – Item Bias

Design: Only even items affected by missing values

slide-5
SLIDE 5

Conclusio (so far)

MCAR: Largely unproblematic, all missing values handling methods performed equally well with respect to item bias. Random imputation and mean imputation outperformed the other principles (but structural missing/CML) in many instances. LR-Test statistic appears to perform well, density misfit probably due to small number of replications (however, this requires affirmation). NMAR: If you have eRm (and perhaps someone who knows how to operate it) at hand, use CML and treat missing values as structurally missing. If not, or if you deliberately want to impute, do not use fixed value imputation (e.g. setting missings to wrong answer). Rather, use item mean or just draw zeros and ones at random.

Thank You!

rainer.alexandrowicz@aau.at