nd sa Tota Total l nitr nitrog ogen en, , 2 nd sampling - - PowerPoint PPT Presentation

nd sa tota total l nitr nitrog ogen en
SMART_READER_LITE
LIVE PREVIEW

nd sa Tota Total l nitr nitrog ogen en, , 2 nd sampling - - PowerPoint PPT Presentation

nd sa Tota Total l nitr nitrog ogen en, , 2 nd sampling mpling in in 20 2013 13 TOT-N 3000 2500 2000 g/l 1500 NTOT (g/l), FI NTOT (g/l), LT 1000 NTOT (g/l), BY 500 NTOT (g/l), LV 0 20 Nov 19 Nov 18 Nov 18


slide-1
SLIDE 1

Tota Total l nitr nitrog

  • gen

en, , 2nd

nd sa

sampling mpling in in 20 2013 13

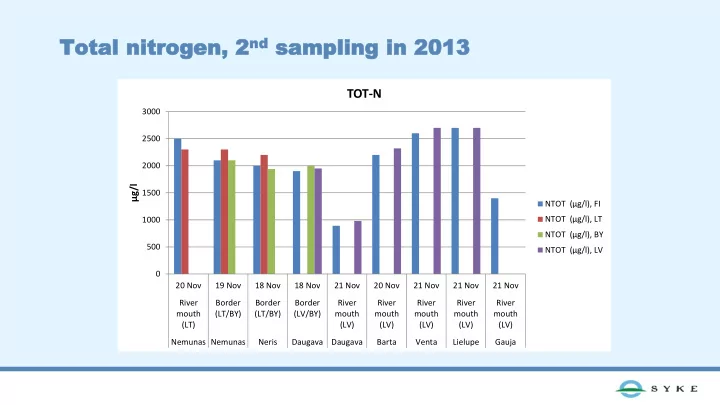
500 1000 1500 2000 2500 3000 20 Nov 19 Nov 18 Nov 18 Nov 21 Nov 20 Nov 21 Nov 21 Nov 21 Nov River mouth (LT) Border (LT/BY) Border (LT/BY) Border (LV/BY) River mouth (LV) River mouth (LV) River mouth (LV) River mouth (LV) River mouth (LV) Nemunas Nemunas Neris Daugava Daugava Barta Venta Lielupe Gauja

µg/l

TOT-N

NTOT (µg/l), FI NTOT (µg/l), LT NTOT (µg/l), BY NTOT (µg/l), LV

slide-2
SLIDE 2

Tota Total l phosphorus phosphorus, , 1st

st sa

sampling mpling in 201 in 2013

20 40 60 80 100 120 140 27 May 28 May 28 May 29 May 29 May 30 May 30 May 30 May River mouth (LT) Border (LT/BY) Border (LT/BY) Border (LV/BY) River mouth (LV) River mouth (LV) River mouth (LV) River mouth (LV) Nemunas Nemunas Neris Daugava Daugava Lielupe Venta Gauja

µg/l

PTOT

PTOT (µg/l), FI PTOT (µg/l), LT PTOT (µg/l), BY1 PTOT (µg/l), BY2 PTOT (µg/l), BY3 PTOT (µg/l), LV

slide-3
SLIDE 3

Tota Total l phosphorus phosphorus, , 2nd

nd sa

sampling mpling in 201 in 2013

20 40 60 80 100 120 140 160 20 Nov 19 Nov 18 Nov 18 Nov 21 Nov 20 Nov 21 Nov 21 Nov 21 Nov River mouth (LT) Border (LT/BY) Border (LT/BY) Border (LV/BY) River mouth (LV) River mouth (LV) River mouth (LV) River mouth (LV) River mouth (LV) Nemunas Nemunas Neris Daugava Daugava Barta Venta Lielupe Gauja

µg/l

PTOT

PTOT (µg/l), FI PTOT (µg/l), LT PTOT (µg/l), BY PTOT (µg/l), LV

slide-4
SLIDE 4
slide-5
SLIDE 5
slide-6
SLIDE 6
slide-7
SLIDE 7

20 40 60 80 100 120 River mouth Belarus border µg/l

Daugava

Tot-P PO4-P 20 40 60 80 100 120 River mouth Belarus border µg/l

Nemunas-Neris

Tot-P PO4-P 20 40 60 80 100 River mouth Belarus border µg/l

Nemunas

Tot-P PO4-P

Phosphorus concentrations in May

slide-8
SLIDE 8

Nitrogen concentrations in May

500 1000 1500 2000 River mouth Belarus border µg/l

Nemunas

Tot-N NO3+NO2-N 500 1000 1500 2000 River mouth Belarus border µg/l

Nemunas-Neris

Tot-N NO3+NO2-N 500 1000 1500 River mouth Belarus border µg/l

Daugava

Tot-N NO3+NO2-N

slide-9
SLIDE 9

Phosphorus concentrations in November

20 40 60 80 100 River mouth Border µg/l

Nemunas

Tot-P PO4-P 20 40 60 80 100 River mouth Border µg/l

Nemunas-Neris

Tot-P PO4-P 20 40 60 80 100 120 River mouth Border µg/l

Daugava

Tot-P PO4-P

slide-10
SLIDE 10

Nitrogen concentrations in November

500 1000 1500 2000 2500 3000 River mouth Belarus border µg/l

Nemunas

Tot-N NO3+NO2-N 500 1000 1500 2000 2500 3000 River mouth Belarus border µg/l

Nemunas-Neris

Tot-N NO3+NO2-N 500 1000 1500 2000 River mouth Belarus border µg/l

Daugava

Tot-N NO3+NO2-N

slide-11
SLIDE 11

Tot Total al ph phos

  • sph

phor

  • rus

us (Tot (Tot-P) P) an and d nitr nitrog

  • gen

en (Tot (Tot-N) N) co conc ncen entr trat ations ions at at the the mou mouth th of

  • f

th the e rive river r Ne Nemun munas as

slide-12
SLIDE 12

Total Total ph phosp

  • spho

horu rus s (Tot (Tot-P) P) concentra tration tions s me measu sure red at th t the bo bord rder r bet between een Lat Latvi via and Belarus a a and Belarus as s well ell as at tw as at two

  • separ

separate ate sampli sampling ng si sites tes (Ri (Riga ga I I and and II) II) nea near r to the mouth to the mouth of t

  • f the river

he river Dau Dauga gava va in in 20 2013 13

slide-13
SLIDE 13

Total Total nitro nitroge gen n (Tot (Tot-N) N) concentra tration tions s me measu sure red at t th the bord rder r betwe tween Lat Latvi via and Belarus a a and Belarus as s well ell as as at two sep at two separa arate te sampli sampling si ng sites tes (Ri (Riga ga I I and and II) II) nea near to the mouth of the riv r to the mouth of the river er Dau Dauga gava va in in 20 2013 13

slide-14
SLIDE 14

Total phospho Total phosphorus rus load of t load of the he Daugava Daugava in 199 in 1991-2013 2013 measured measured at at the ri the river ver mouth and mouth and the B the Belorussian elorussian borde border

slide-15
SLIDE 15

Total ni Total nitrogen load trogen load of t

  • f the

he Daug Daugava ava in 199 in 1991-2012 2012 measured measured at the river mouth and at the river mouth and the B the Belorussian elorussian borde border

slide-16
SLIDE 16

Total phospho Total phosphorus rus load of t load of the he Nemuna emunas in 1 in 199 994-2013 2013 measured measured at at the ri the river ver mouth and mouth and the B the Belorussian elorussian borde border

slide-17
SLIDE 17

To Total nitr tal nitrog

  • gen

en l loa

  • ad

d of the

  • f the Nemu

Nemuna nas in 19 in 1994 94-20 2012 12 mea measure sured d at the river mouth (H at the river mouth (HELCO ELCOM PLC data base) M PLC data base) and and the the Bel Belorussian

  • russian borde

border r

slide-18
SLIDE 18

Tota Total l phos phosphor phorus us load load measur measured ed at the at the bord border er betwee between n Latv Latvia ia and and Belarus Belarus

slide-19
SLIDE 19

Tota Total l nitrog nitrogen en load load measur measured ed at at the bor the border der betwee between n Latv Latvia ia and and Belar Belarus us

slide-20
SLIDE 20

Tota Total l phos phosphor phorus us load load measur measured ed at the at the bord border er betwee between n Lithuan Lithuania ia and and Belarus Belarus

slide-21
SLIDE 21

Tota Total l nitrog nitrogen en load load measur measured ed at at the bor the border der betwee between n Latv Latvia ia and and Belar Belarus us

slide-22
SLIDE 22

Thank you!