SLIDE 1
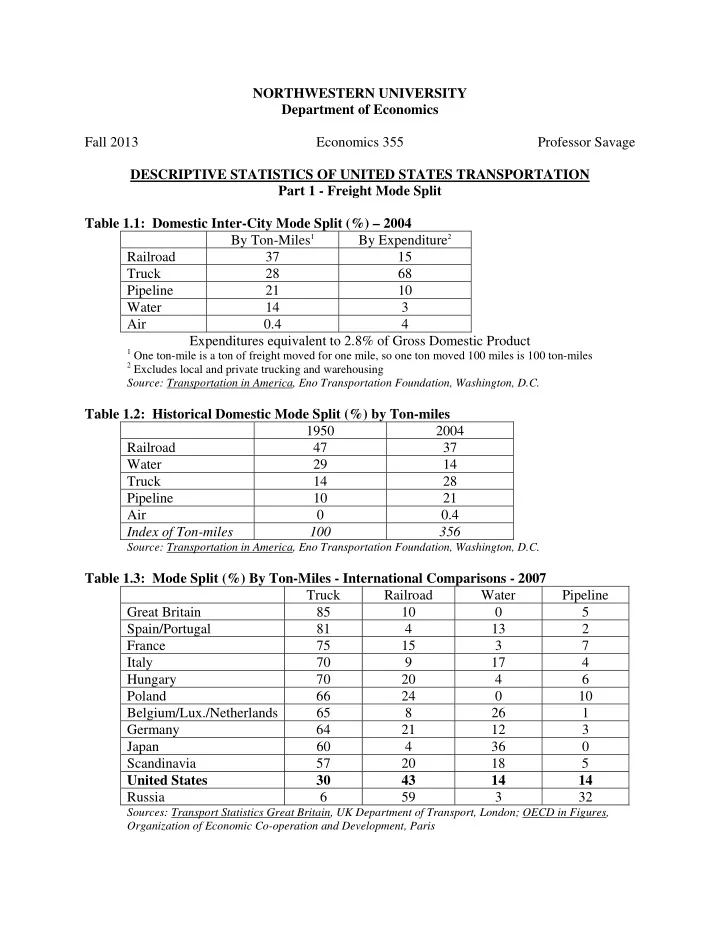
NORTHWESTERN UNIVERSITY Department of Economics Fall 2013 Economics 355 Professor Savage DESCRIPTIVE STATISTICS OF UNITED STATES TRANSPORTATION Part 1 - Freight Mode Split Table 1.1: Domestic Inter-City Mode Split (%) – 2004 By Ton-Miles1 By Expenditure2 Railroad 37 15 Truck 28 68 Pipeline 21 10 Water 14 3 Air 0.4 4 Expenditures equivalent to 2.8% of Gross Domestic Product
1 One ton-mile is a ton of freight moved for one mile, so one ton moved 100 miles is 100 ton-miles 2 Excludes local and private trucking and warehousing
Source: Transportation in America, Eno Transportation Foundation, Washington, D.C.
Table 1.2: Historical Domestic Mode Split (%) by Ton-miles 1950 2004 Railroad 47 37 Water 29 14 Truck 14 28 Pipeline 10 21 Air 0.4 Index of Ton-miles 100 356
Source: Transportation in America, Eno Transportation Foundation, Washington, D.C.
Table 1.3: Mode Split (%) By Ton-Miles - International Comparisons - 2007 Truck Railroad Water Pipeline Great Britain 85 10 5 Spain/Portugal 81 4 13 2 France 75 15 3 7 Italy 70 9 17 4 Hungary 70 20 4 6 Poland 66 24 10 Belgium/Lux./Netherlands 65 8 26 1 Germany 64 21 12 3 Japan 60 4 36 Scandinavia 57 20 18 5 United States 30 43 14 14 Russia 6 59 3 32
Sources: Transport Statistics Great Britain, UK Department of Transport, London; OECD in Figures, Organization of Economic Co-operation and Development, Paris
SLIDE 2
Professor Savage 2 Economics 355 Part 2 - Passenger Mode Split Table 2.1: Domestic Passenger Mode Split (%) – 20041 By Passenger-Miles By Trips By Expenditure
Inter-city journeys Journey to Work Excluding Subsidies
Automobile 72.3 86.2 89.7 Air 24.8 0.0 8.2 Inter-City Bus 2.7 0.0 0.2 Urban Transit – 5.9 0.9 Walk – 2.8 – Railroad 0.3 – 0.1 Bicycle/Motorcycle – 0.7 – Taxi – 0.1 0.8 Water 0.0 0.0 0.1 Work at Home – 4.1 – Expenditures equivalent to 9.6% Gross Domestic Product
1 Excludes school and charter buses
Sources: Expenditure, Inter-city passenger-miles: Transportation in America, Eno Transportation Foundation, Washington, D.C.; Journey to work: American Community Survey, US Census Bureau (2008 data)
Table 2.2: Historical Domestic Inter-City Mode Split (%) by Passenger-Miles 1950 2004 Automobile 88 72 Air 2 25 Inter-City Bus 5 2.7 Railroad 5 0.3 Index of Passenger-miles 100 455
Source: Transportation in America, Eno Transportation Foundation, Washington, D.C.
Table 2.3: Mode Split (%) By Passenger-Miles1 - International Comparisons - 2007 Auto/Taxi Bus Rail Air Great Britain 86 6 6 1 United States 86 3 10 Germany 85 6 8 1 France 85 6 8 1 Poland 84 10 7 Belgium/Lux./Netherlands 82 10 8 Scandinavia 82 8 7 2 Italy 82 12 6 1 Spain/Portugal 77 13 5 5 Hungary 61 26 13 Japan 57 7 31 5
1 Both inter-city and urban trips. One passenger-mile is a person traveling for one mile, so one person
traveling 100 miles is 100 passenger-miles Source: Transport Statistics Great Britain, UK Department of Transport, London
SLIDE 3 Professor Savage 3 Economics 355 Part 3 - Railroads Table 3.1: Freight Traffic Components (%) – 2011 By Tons By Revenue Coal 43 25 Food & Farm Products 14 16 Chemicals & Oil / Oil Products 13 17 Minerals & Ores 13 7 Manufactured Goods & Equipment 13 28 Forest Products 3 5
Source: Railroad Facts, Association of American Railroads, Washington D.C.
Table 3.2: Market Share, Traffic Density, Traffic Value and Profit Margin – 2011 Market Share
(%) Traffic Density2 (millions) Revenue per Ton-Mile (¢) Operating Profit Margin (%) BNSF 33 20.1 3.0 36 Union Pacific 28 17.1 3.6 39 CSX Transportation 12 10.9 5.1 34 Norfolk Southern 10 9.5 5.8 36 Canadian National 10 9.4 4.9 58 Canadian Pacific 7 8.8 4.1 23 Kansas City Southern 2 9.9 3.8 34
1 Market share is of combined United States and Canada market for large (class 1) railroads 2 Traffic Density is calculated by dividing ton-miles by route-miles. It indicates the average amount of
usage the tracks of a railroad receive in a year Source: Railroad Facts, Association of American Railroads, Washington D.C.
SLIDE 4
Professor Savage 4 Economics 355 Part 4 - Water Transportation Table 4.1: Geographic Share (%) - 2010 By Tonnage By Expenditure (2004) International: Imports 39 56 International: Exports 25 31 Domestic: Rivers & Canals 25 8 Domestic: Coastal 7 5 Domestic: Great Lakes 4 1
Sources: Tonnage: Waterborne Commerce of the United States, US Army Corps of Engineers; Expenditures: Transportation in America, Eno Transportation Foundation, Washington, D.C.
Table 4.2: Major American Ports - 2010 Market Share % by Tonnage Proportion of Traffic Foreign Trade (%) Galveston / Houston, TX 12.8 70 South Louisiana Offshore Oil Port 10.1 49 New York, NY/NJ 6.0 60 Los Angeles / Long Beach, CA 5.9 86 Baton Rouge, LA 4.8 36 Port Arthur / Beaumont, TX 4.6 66 Philadelphia, PA/NJ 3.6 61 Corpus Christi Bay, TX 3.2 74 New Orleans, LA 3.1 47 Norfolk / Newport News, VA 2.8 82 Huntington, WV/KY/OH 2.7 Duluth & North Shore, WI/MN 2.4 18 Mobile, AL 2.4 37 Lake Charles, LA 2.3 60 Columbia River Estuary, OR/WA 2.3 78 Puget Sound, WA 2.2 78 Port of Chicago, IL/IN 2.1 9 San Francisco Bay, CA 1.9 69 Pascagoula, MS 1.8 67
Source: Waterborne Commerce of the United States, US Army Corps of Engineers
Table 4.3: Traffic Split by Commodity (%) By Tonnage - 2010 Foreign Domestic Crude Oil & Products 49 37 Coal 7 25 Minerals & Ores 10 17 Food & Farm Products 15 9 Chemicals 8 7 Manufactured Goods 5 3 Manufactured Equipment 6 2
Source: Waterborne Commerce of the United States, US Army Corps of Engineers
SLIDE 5 Professor Savage 5 Economics 355 Part 5 - Airlines (US Flag Carriers Only) Table 5.1: Index of Domestic Airline Traffic with 1950 =100 (and % Change in Decade) Passenger-miles Cargo (Ton-miles) 1950 100 100 1960 341 241% 297 197% 1970 1177 245% 1100 270% 1980 2198 87% 1613 47% 1990 3719 69% 3473 115% 2000 5550 49% 5270 52% 2010 5975 11% 4180
Source: Transportation in America, Eno Transportation Foundation, Washington, D.C.; Bureau of Transportation Statistics, US Department of Transportation, Washington D.C. (US DOT Form 41 data)
Table 5.2: Market Share, Cost, and Operating Profit Margin - 2012 Market Share of Passenger-miles1 (%) Cost per Available Seat-Mile2 (¢) Operating Profit Margin (%) Proposed merged American Airlines 21 16.8 + 2
Original American 13 16.2 US Airways 8 17.9 + 6
Southwest / AirTran 18 12.3 + 8 United Airlines 17 17.2 Delta Air Lines 16 17.1 + 7 JetBlue Airways 5 11.5 + 8 Alaska Airlines 4 14.5 +14 Hawaiian Airlines 2 12.5 + 7 Frontier Airlines 2 11.8 + 2 Other Airlines 16
(mainly regional and commuter airlines)
1 Market share based on domestic operations 2 An available seat-mile is one seat on an aircraft flown one mile irrespective of whether the seat is
- ccupied or not. Therefore flying a 100-seat aircraft for 100 miles produces 10,000 available seat miles
Source: Bureau of Transportation Statistics, US Department of Transportation, Washington D.C.
Table 5.3: Ten Largest Airports for Passengers and Freight - 2012 Passenger (Million Enplanements) Freight (Million Tons Aircraft Weight) 1 Atlanta 45.8 Memphis 10.3 (FedEx) 2 Chicago O'Hare 32.2 Anchorage 8.3 3 Los Angeles 31.3 Louisville 5.5 (UPS) 4 Dallas-Fort Worth 28.0 Miami 3.6 5 Denver 25.8 Indianapolis 2.5 (FedEx) 6 New York JFK 24.5 Chicago O’Hare 2.3 7 San Francisco 21.3 Los Angeles 2.1 8 Charlotte 20.0 New York JFK 1.8 9 Las Vegas 19.9 Cincinnati 1.6 (DHL) 10 Phoenix 19.6 Dallas-Fort Worth 1.5
Source: Bureau of Transportation Statistics, US Department of Transportation, Washington D.C.
SLIDE 6 Professor Savage 6 Economics 355 Part 6 - Highway Freight Table 6.1: Firm Type and Commodities Hauled (%) By Ton-Miles - 2007 For-Hire Trucking1 Private Trucking1 Total Manufactured Goods & Equipment 25.4 6.4 31.8 Food & Farm Products 19.5 4.5 24.0 Chemicals 11.5 2.0 13.5 Coal, Minerals & Ores, Scrap, Waste 9.1 4.0 13.1 Forest Products 9.9 1.8 11.8 Oil & Oil Products 3.3 2.5 5.9
1 For-hire trucking are commercial trucking firms offering trucking service to whoever wants to purchase
the service. Private trucking are vehicles owned by agricultural, mining, manufacturing, and retail companies to move their own products Source: Commodity Flow Survey 2007, US Census Bureau / Bureau of Transportation Statistics, US Department of Transportation, Washington, D.C.
Table 6.2: Largest For-Hire Trucking Firms - 2012 Revenue ($ Million) Operating Profit Margin (%) Market Segment 2 Package Companies United Parcel Service 54,127 + 3 Package FedEx Express 27,171 + 2 Package FedEx Ground 10,578 +20 Package Freight Companies Con-Way Transportation 5,580 + 4 LTL General Freight FedEx Freight 5,401 + 4 LTL General Freight J.B. Hunt Transport 5,055 +12 TL General Freight Yellow Roadway Corp 4,850
LTL General Freight Schneider National Carriers 3,500 NA1 TL General Freight Swift Transportation 3,494 +10 TL General Freight TransForce 3,139 + 8 LTL General Freight CEVA Logistics 2,880 +10 TL General Freight Landstar System 2,793 + 8 TL General Freight Ryder Supply Chain Solutions 2,281 + 5 TL General Freight Old Dominion Freight Line 2,110 + 9 LTL General Freight ABF Freight System 2,066
LTL General Freight Werner Enterprises 2,036 + 5 TL General Freight SIRVA (Allied, North American Van Lines) 1,973 NA1 Household Goods Estes Express Lines 1,865 NA1 LTL General Freight USXpress Enterprises 1,756 NA1 TL General Freight UniGroup (United Van Lines) 1,613 NA1 Household Goods
1 Privately held company 2 TL=Truckload, LTL=Less-than-truckload
Source: Commercial Carrier Journal, August 2012, individual company Annual Reports
SLIDE 7
Professor Savage 7 Economics 355 Part 7 - Automobiles Table 7.1: Growth in Licensed Drivers and Auto Ownership Year Percent of US Population with Drivers License Vehicles per Licensed Driver 1969 52 0.70 1977 60 0.94 1983 64 0.98 1990 68 1.01 1995 68 0.99 2001 68 1.06 2009 66 1.09
Source: National Household Travel Survey, Federal Highway Administration
Table 7.2: Household Automobile Availability - 2009 Household Size Percentage of Households with No Auto One Auto Two Autos 3+ Autos 1 adult 21 63 12 4 2 adults 4 17 53 36 3+ adults 4 11 22 63
Source: National Household Travel Survey, Federal Highway Administration
Table 7.3: Distribution of Vehicles Miles of Travel by Trip Purpose (%) - 2009 To and from Work & Work Related 37.0 Social and Recreational 30.0
Other Social & Recreational 22.7 Dining Out 7.4
Family and Personal Business 28.6
Shopping/Errands 20.3 Other Family & Personal Business 5.5 Doctor/Dentist 2.8
School & Church 4.4
Source: National Household Travel Survey, Federal Highway Administration